Trending
The latest

Topics
Bathroom Accents
10
Posts
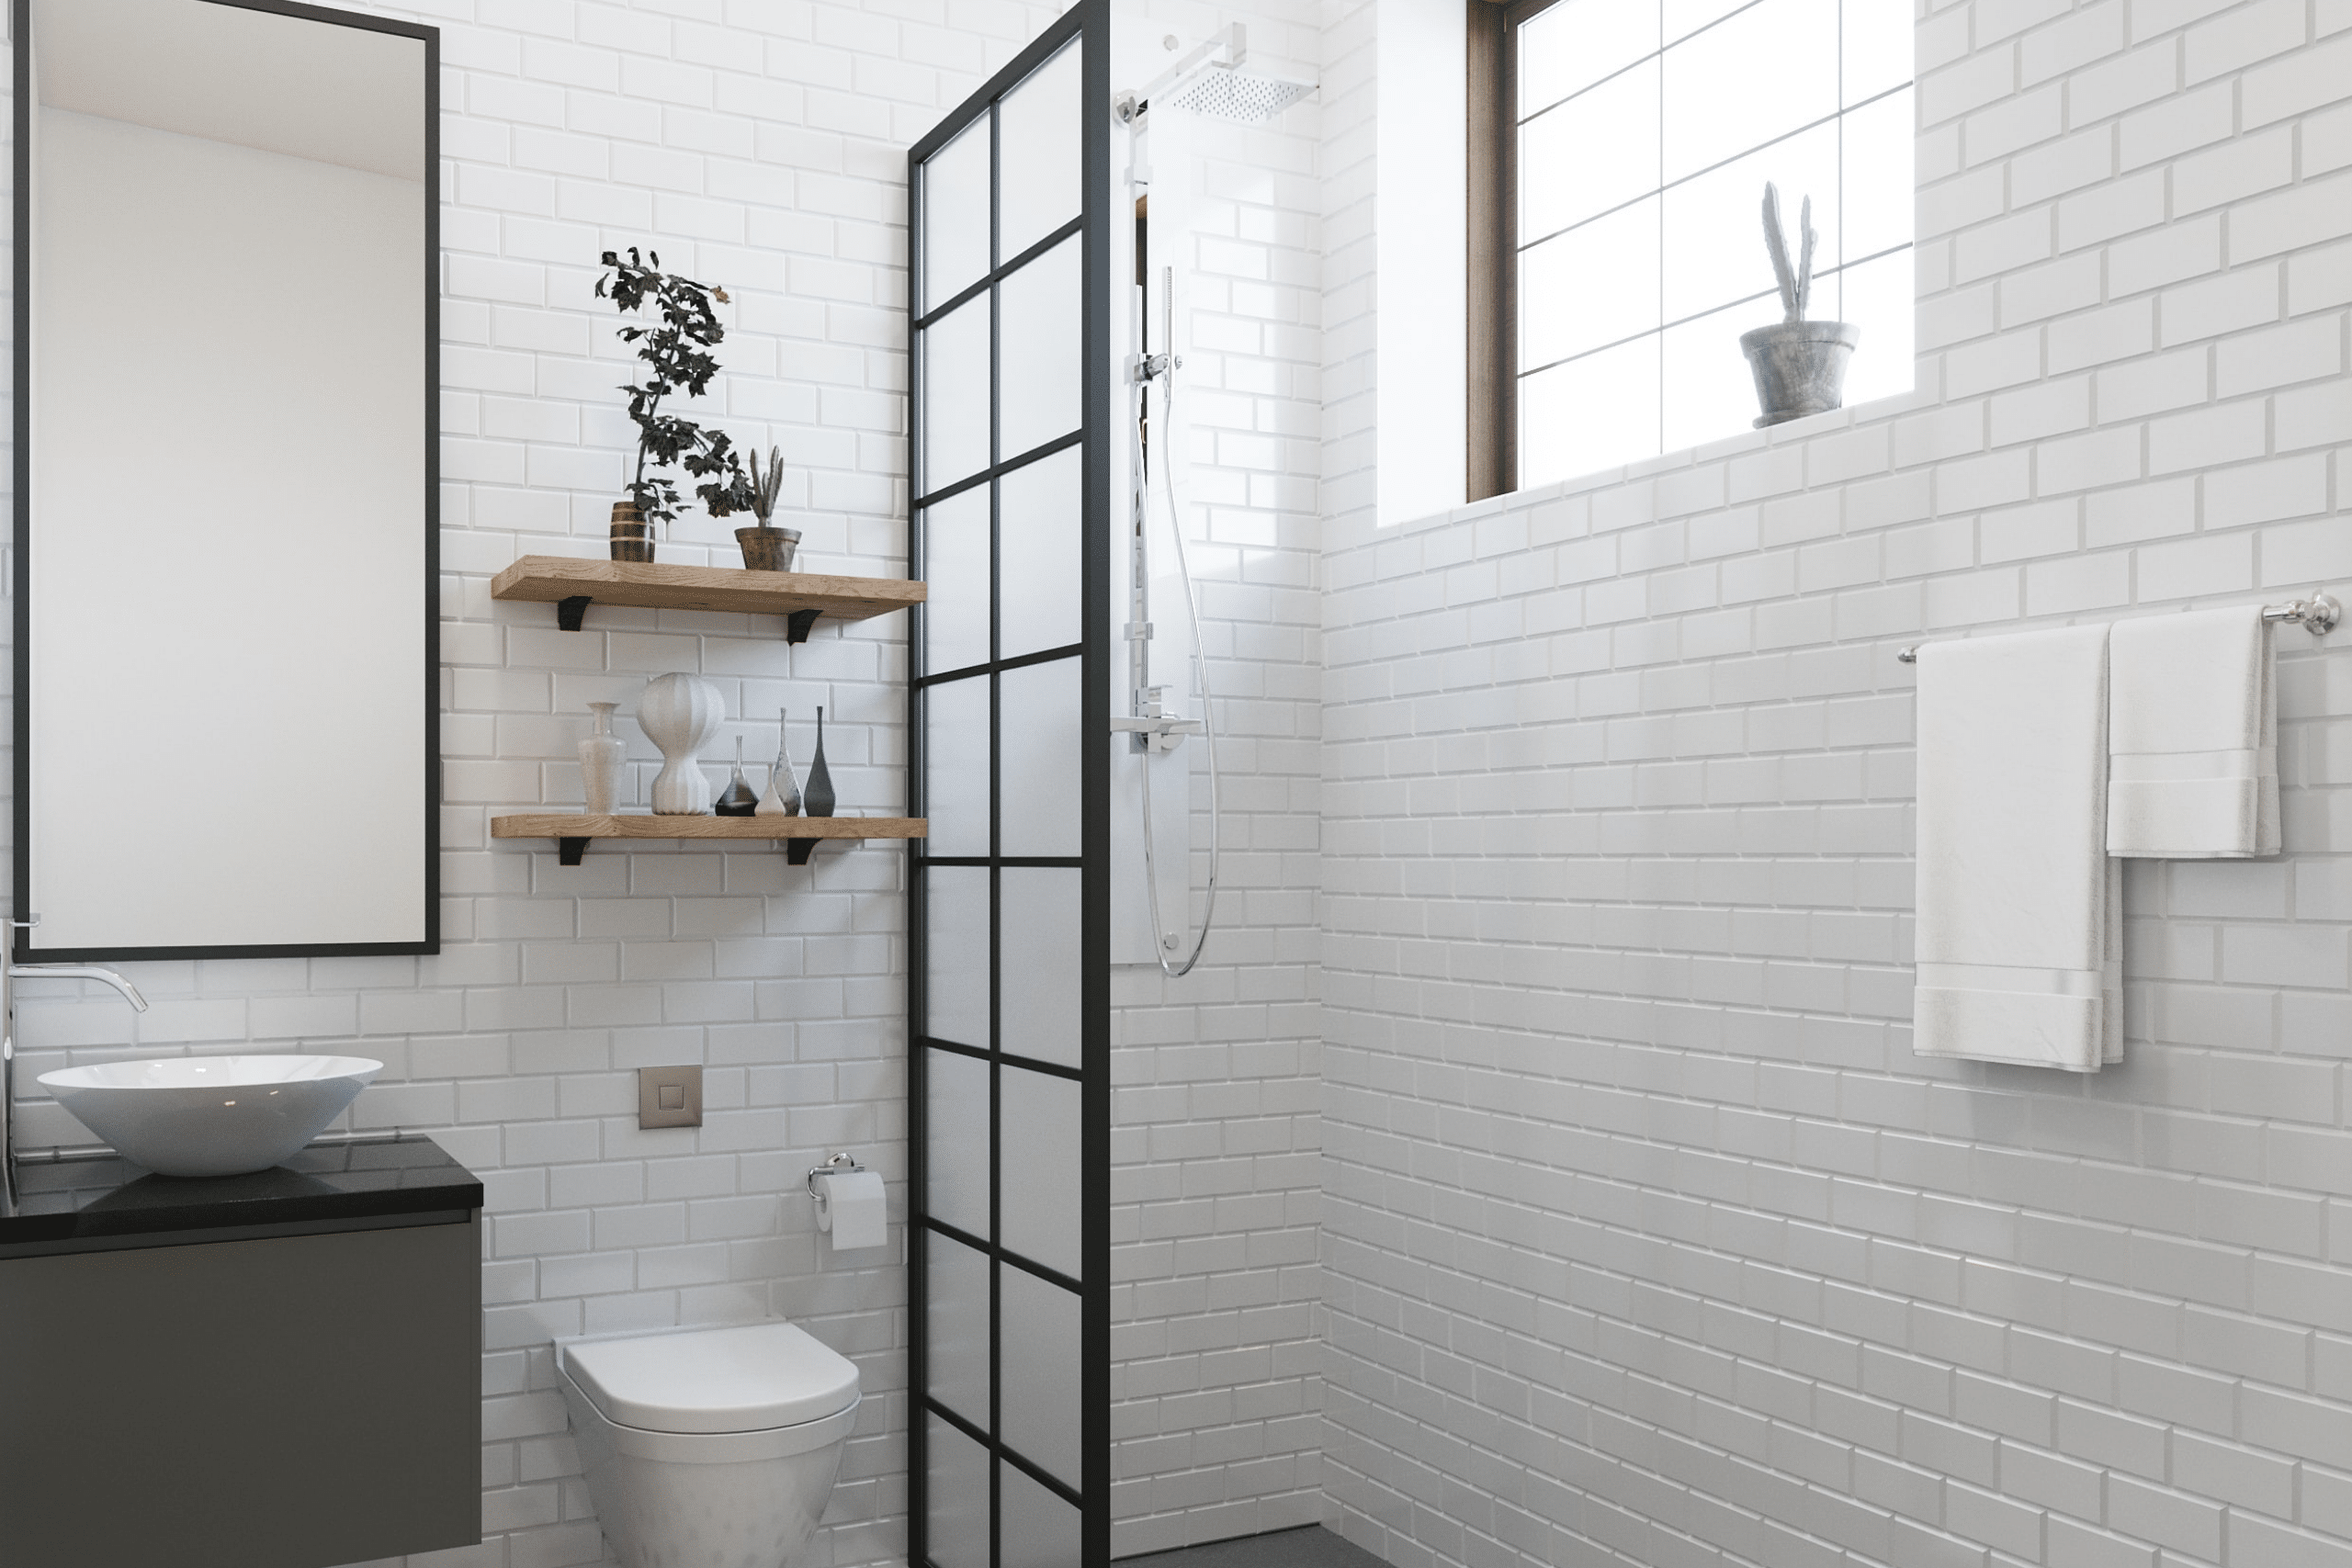
Bathroom Design
10
Posts
Bedroom Design
6
Posts
DIY & Crafts
3
Posts
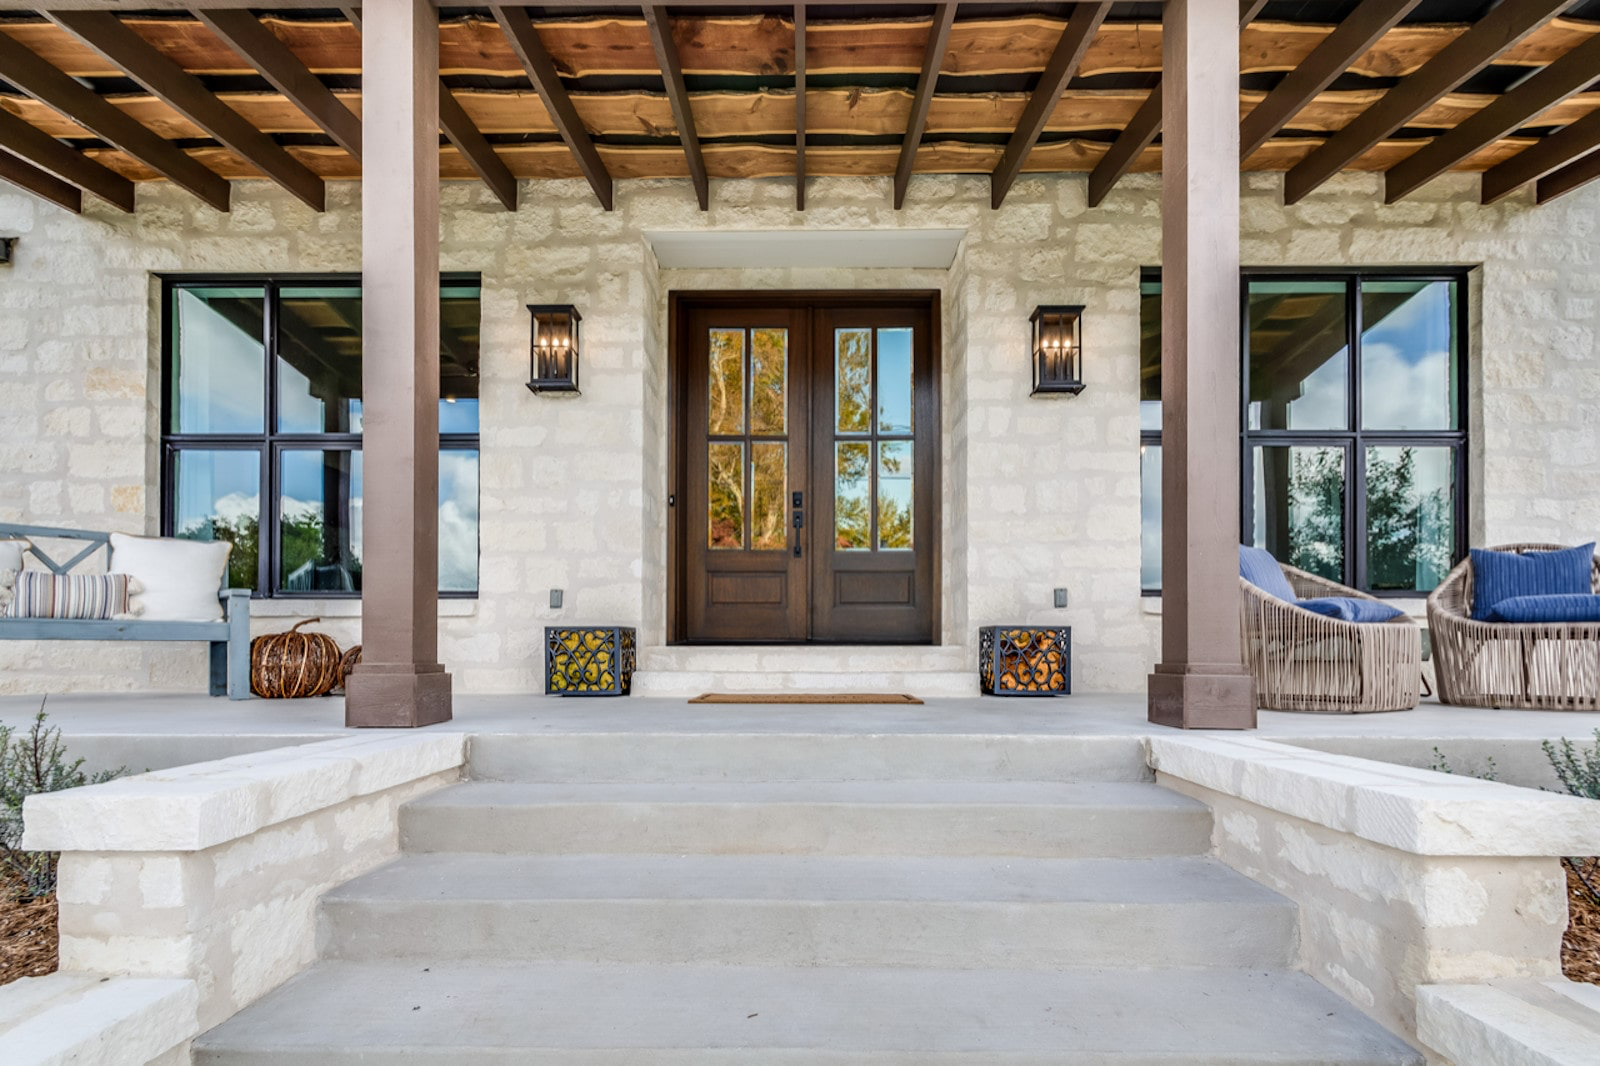
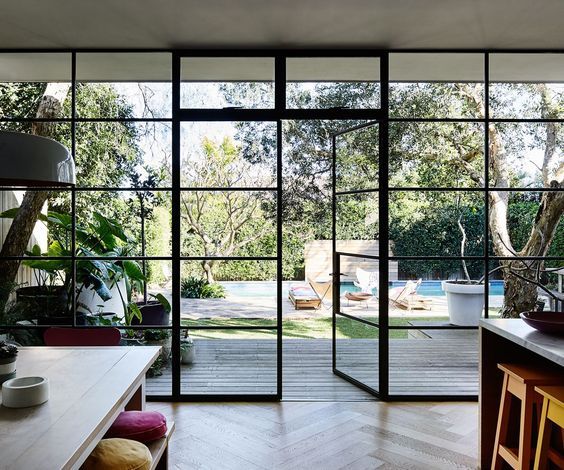
Doors & Windows
10
Posts
Garden & Landscaping
5
Posts
Home Decor
79
Posts
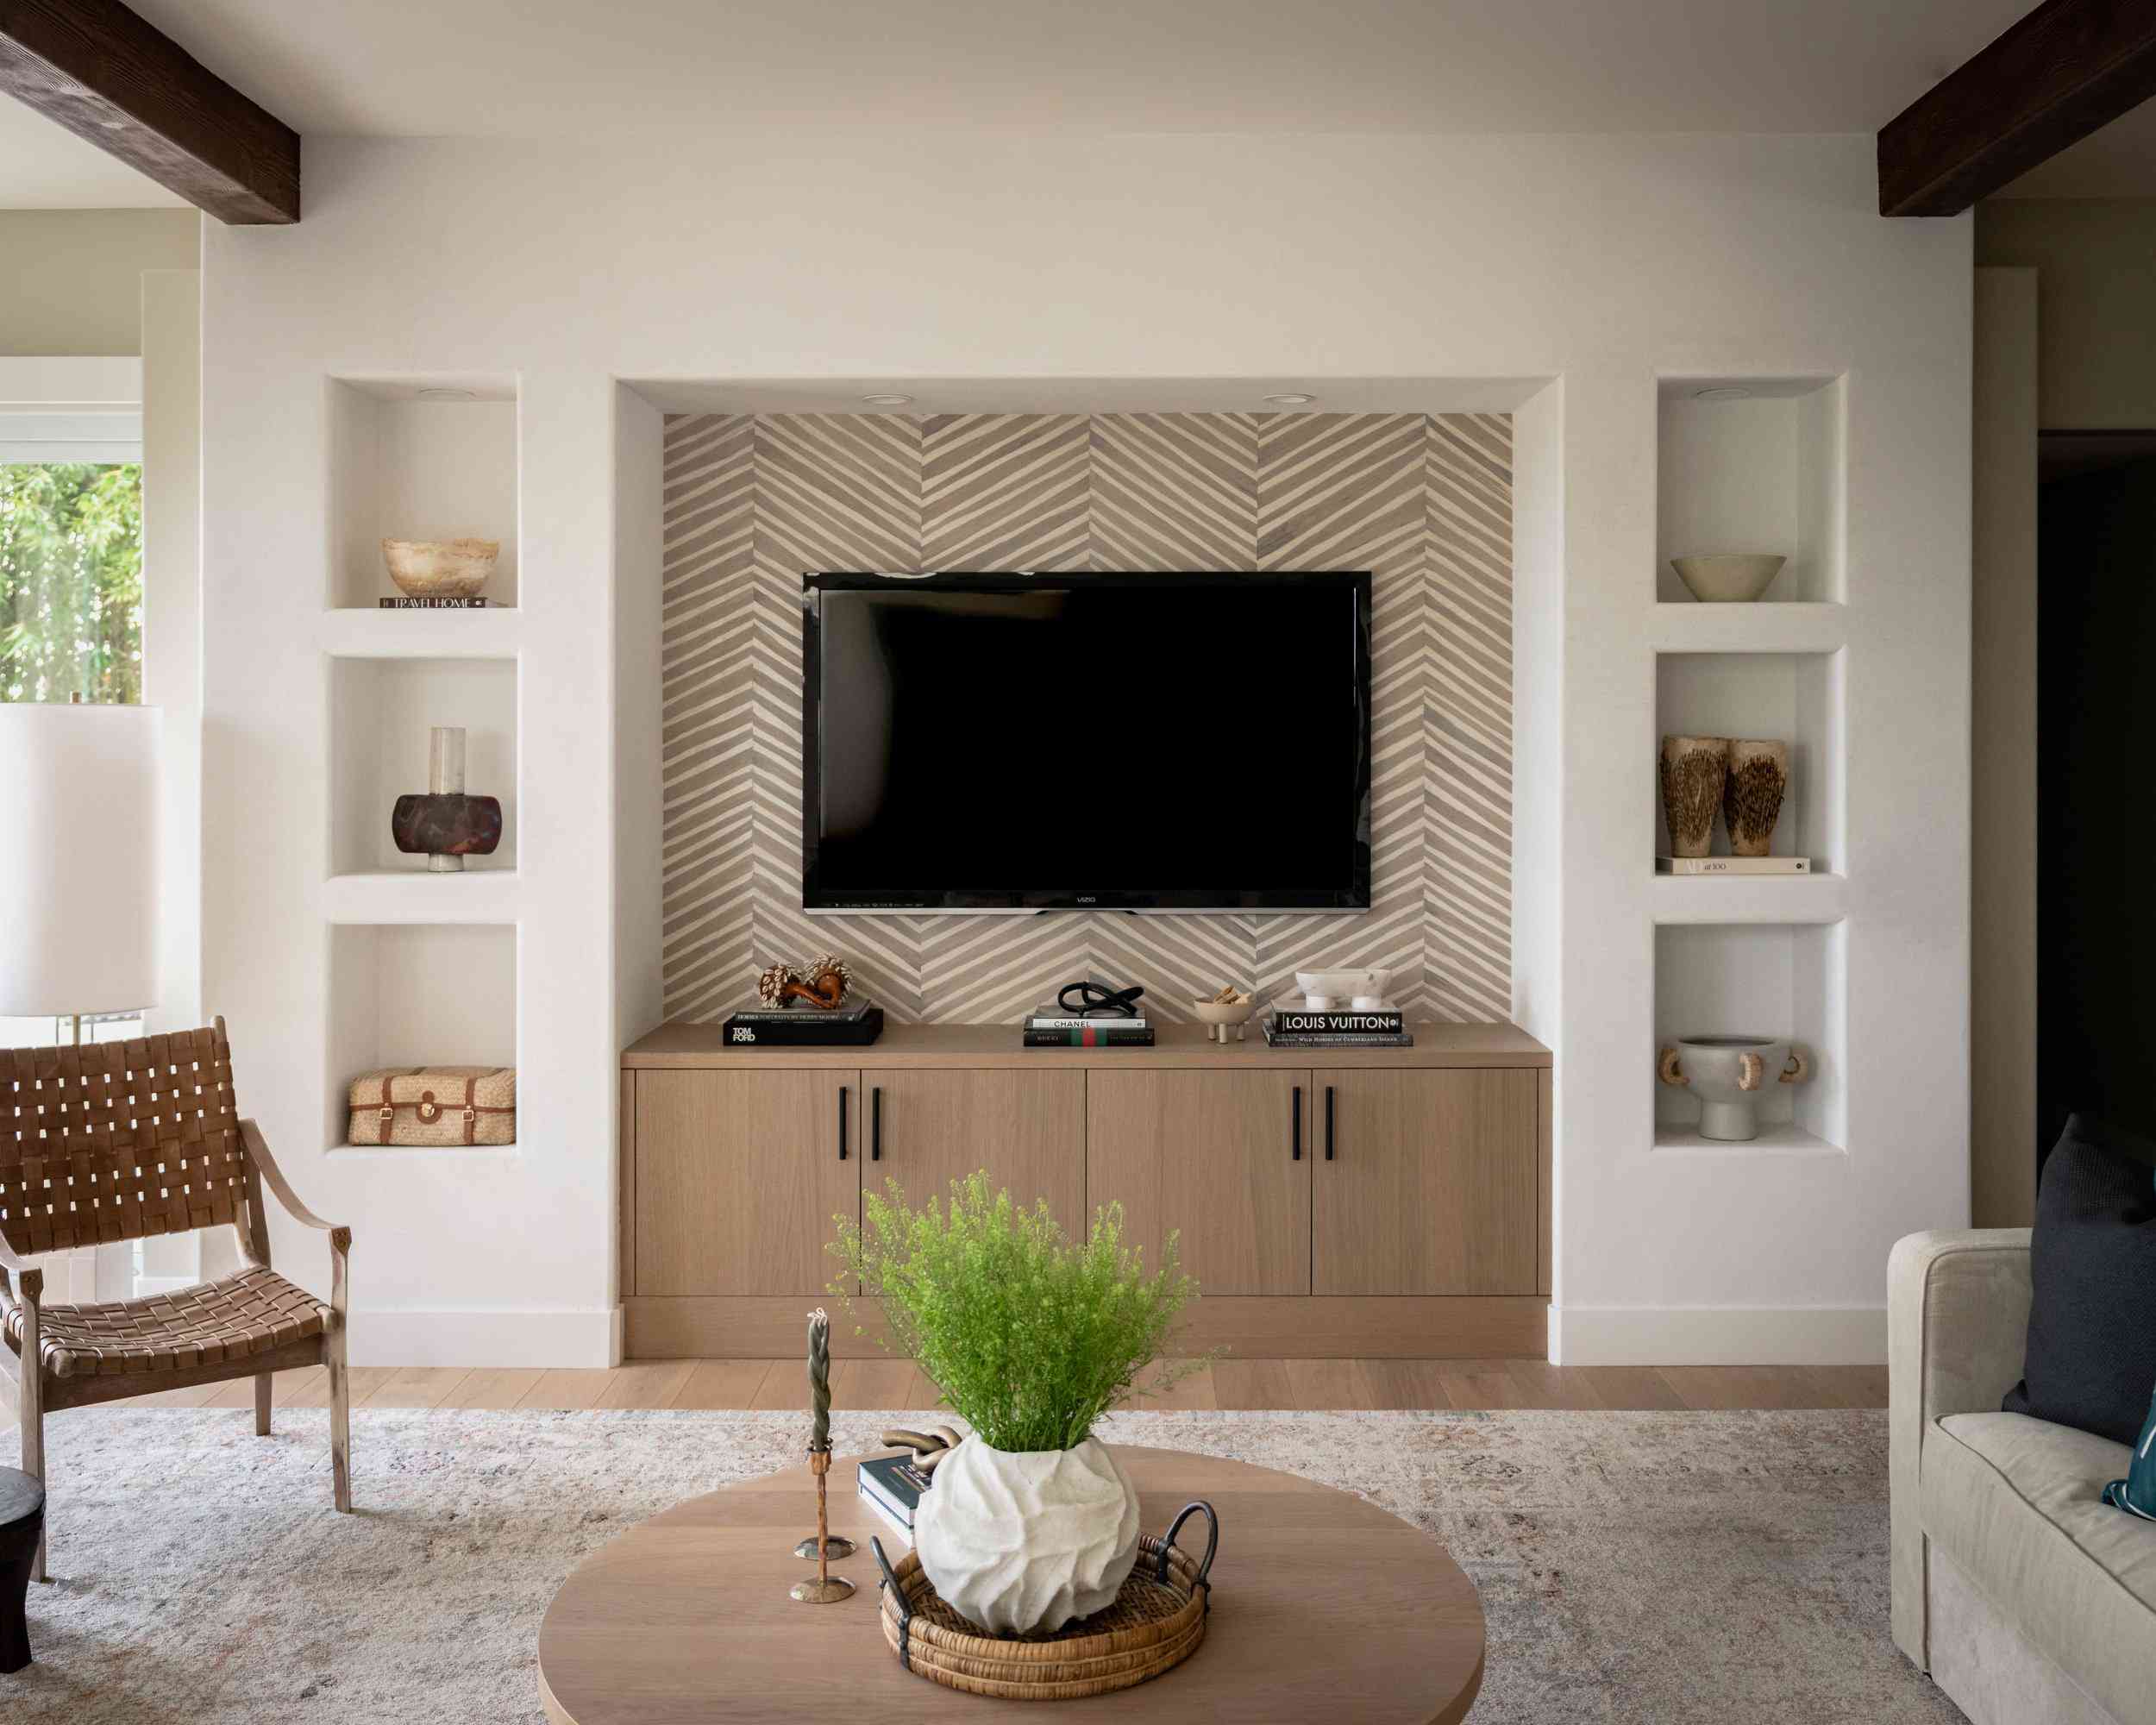
Home Design
13
Posts
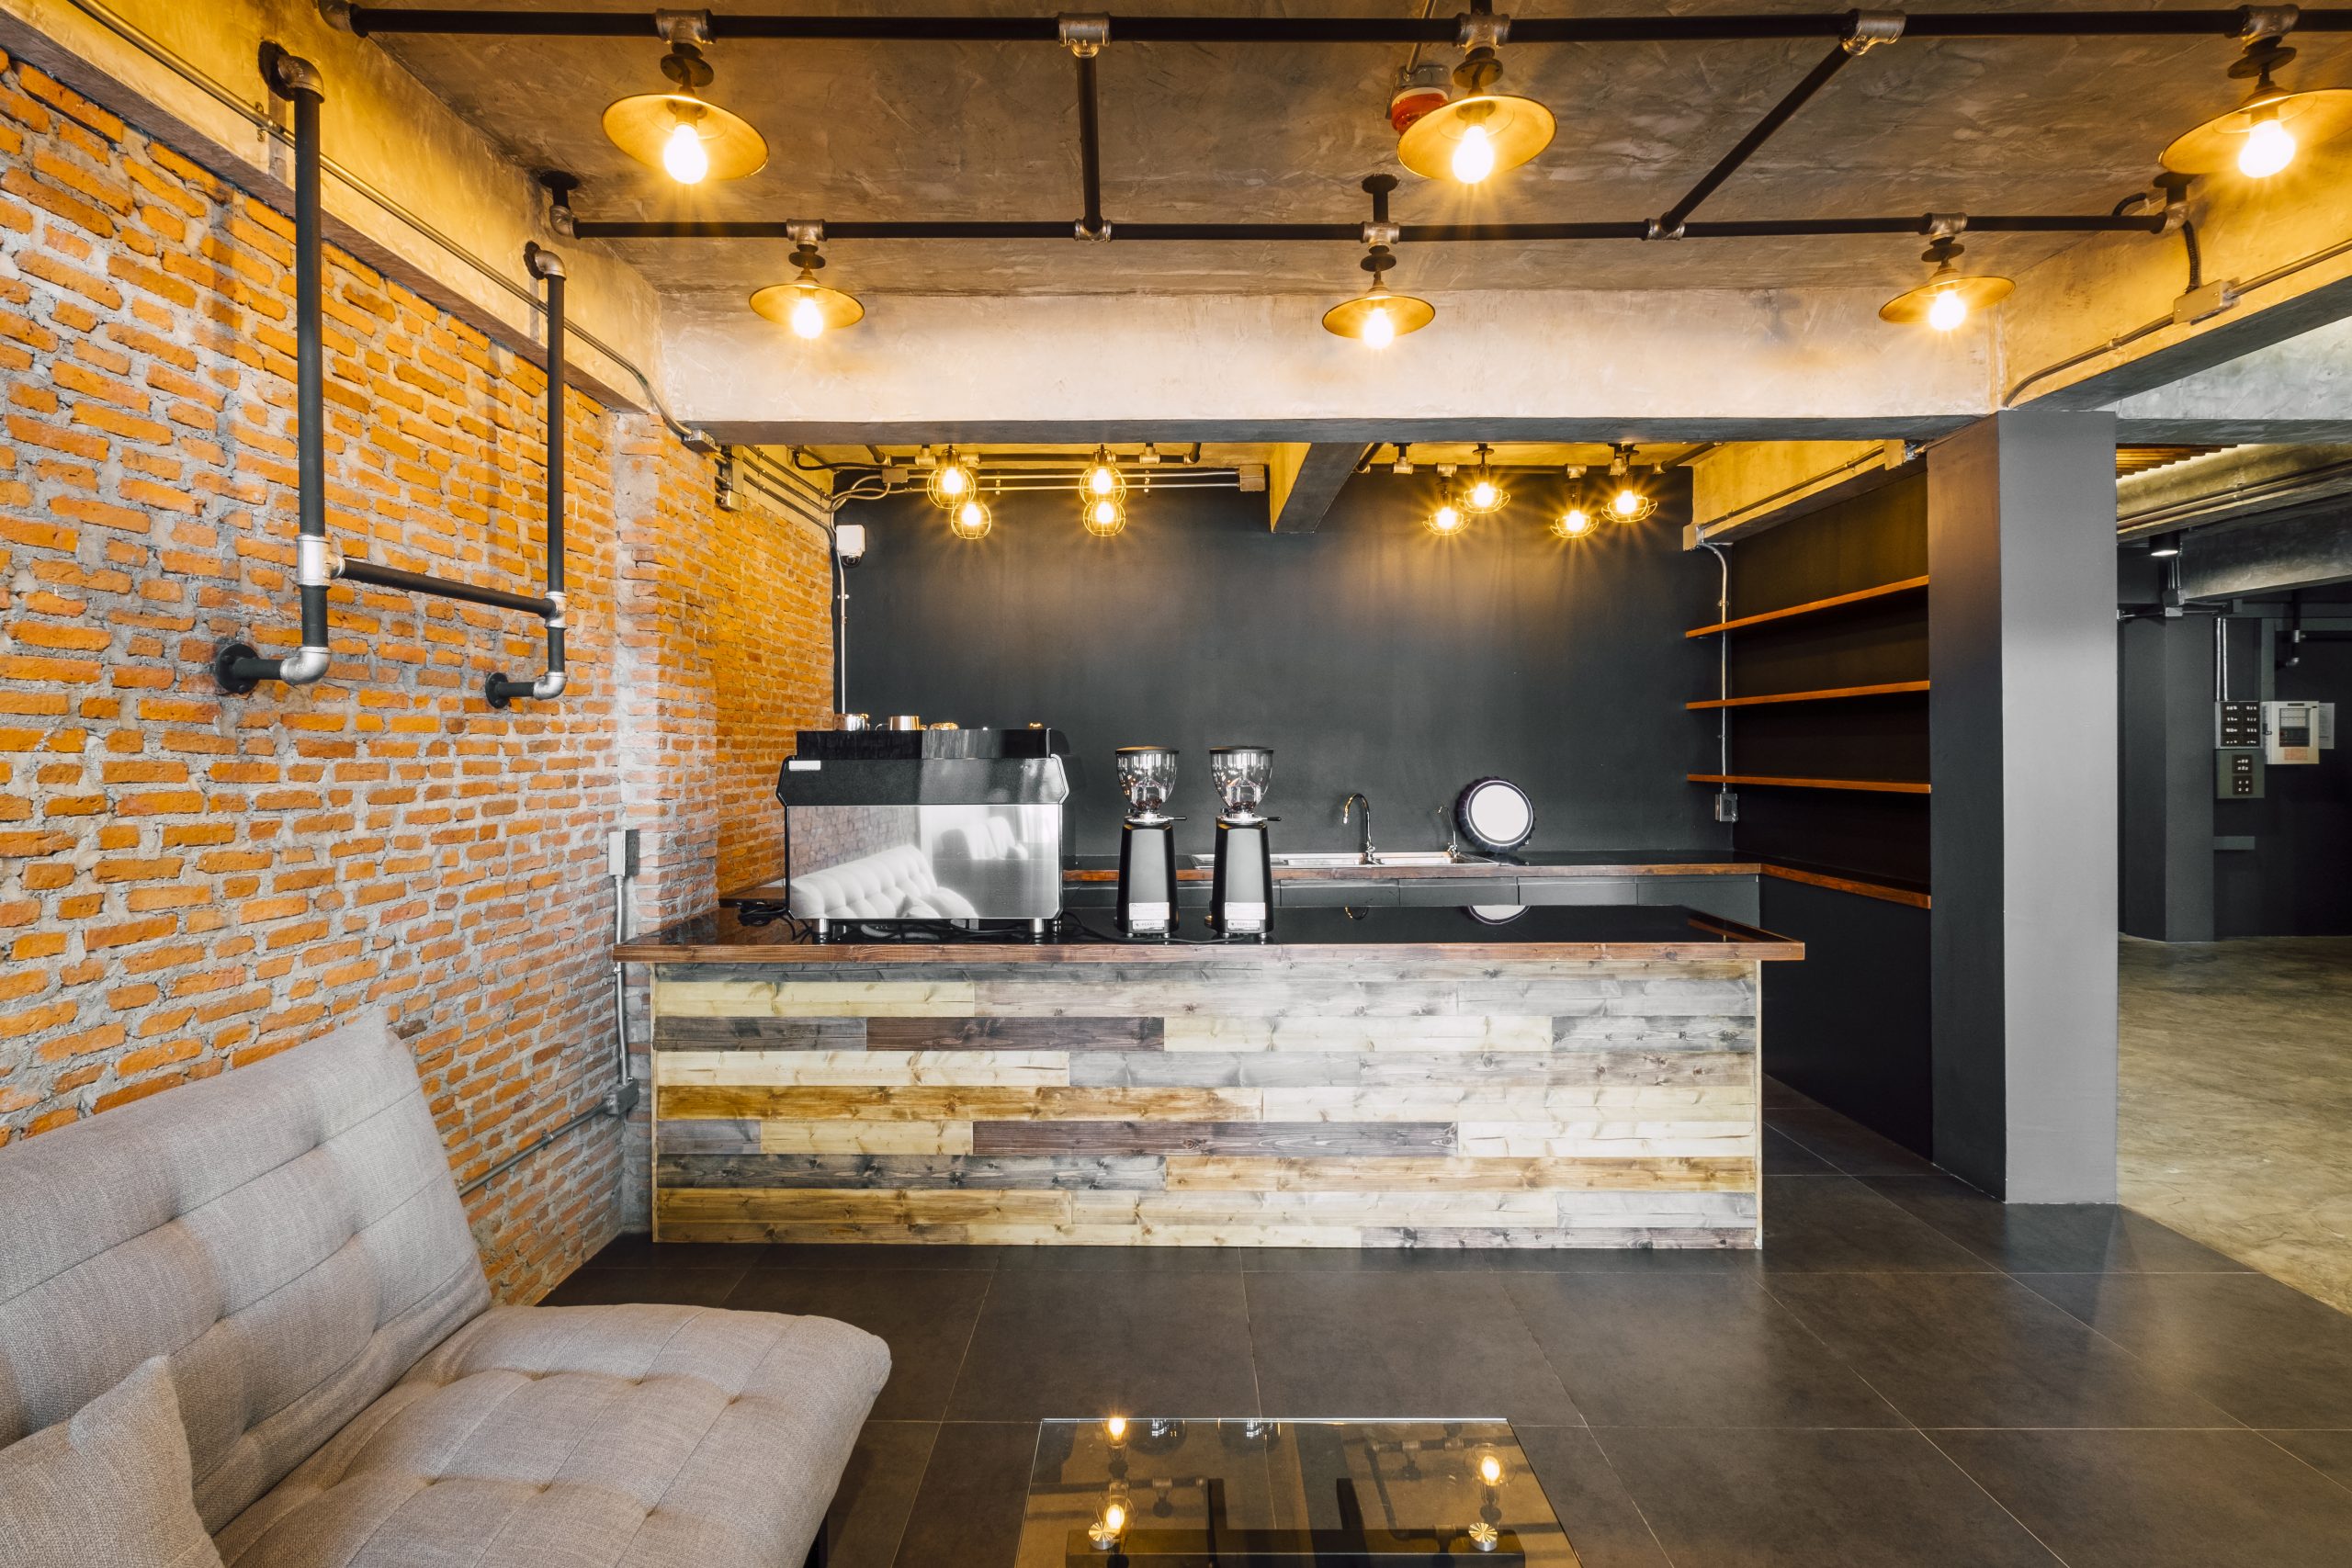
Interior Design
22
Posts
Kitchen & Dining Accents
14
Posts
Kitchen & Dining Design
14
Posts
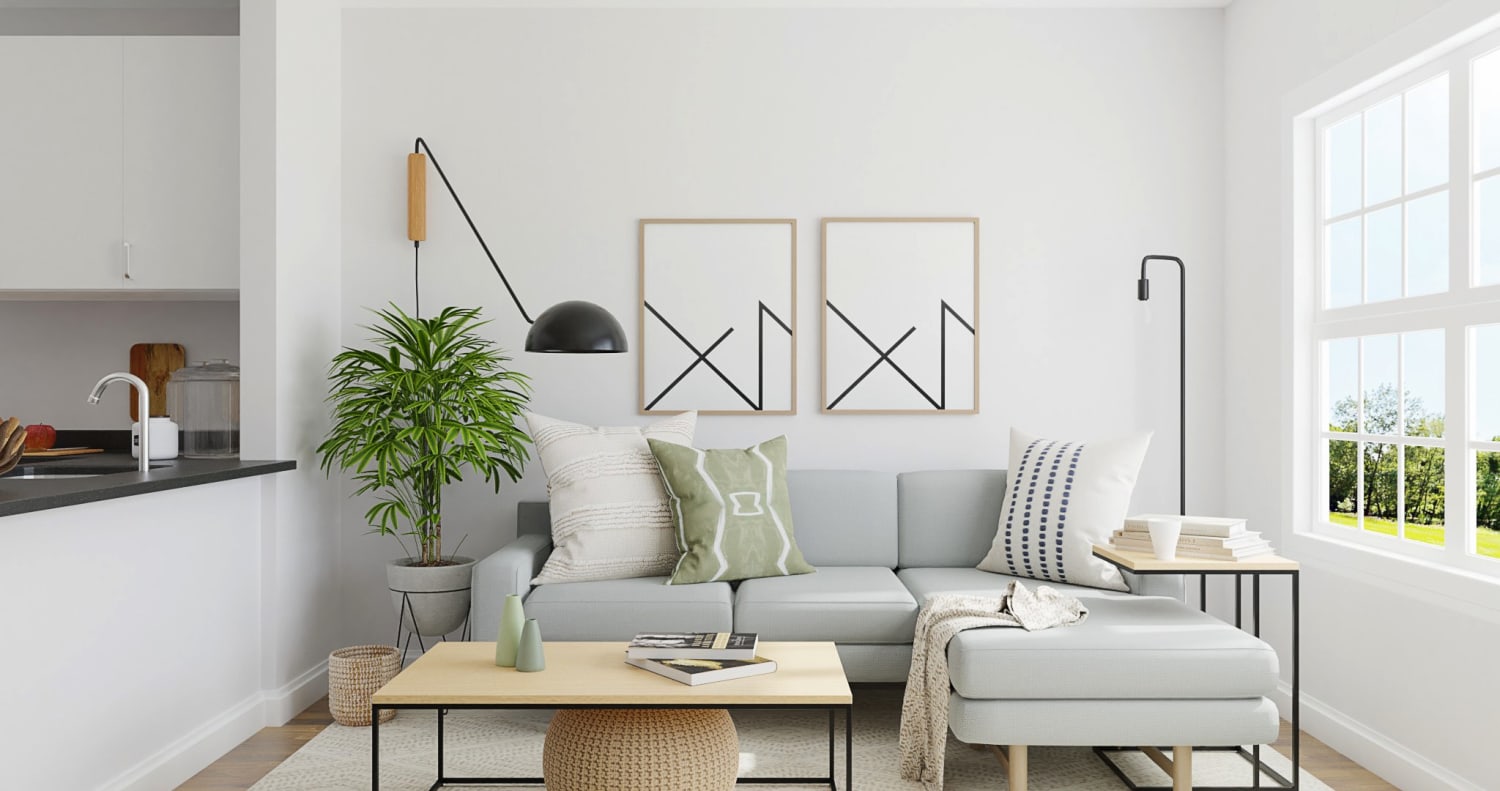
Living Spaces
1
Posts
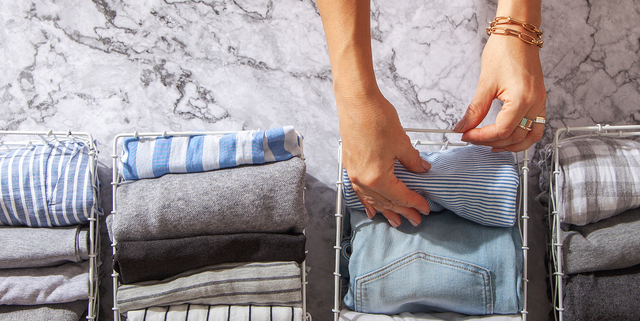
Organization
7
Posts
Outdoor & Garden
12
Posts
Tips & Guide
31
Posts
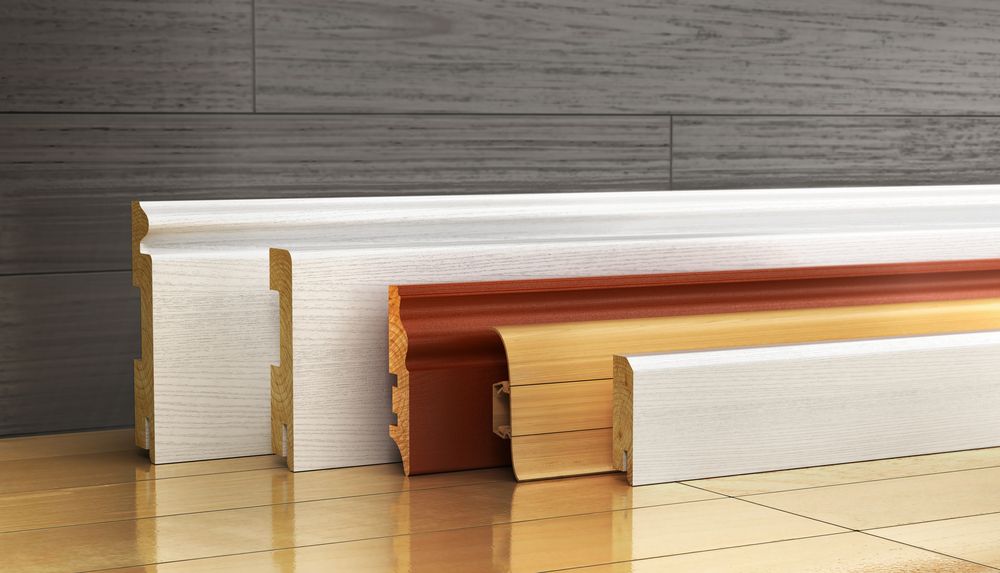
Wall & Floor Accents
5
Posts
SUBSCRIPTION
Subscribe to our newsletter and receive a selection of cool articles every weeks
Follow Us