Interesting juncture in sentiment

We reached a point this week where almost all bears turned short-term bullish at the very least, if they didn’t swear off shorting altogether. Hordes of hobby bears were crushed over the last three weeks, and even hard core bears from before 2008 seemed to adjust their wave 2 targets upward as high as SPX 1200.

I took that as a sign of short-term weakness at the very least, so in addition to my regular purchase of December 2011 puts, I added a few March QQQQ puts and October 09 calls on the 10 year note. This AM I also took another stab at picking a top in copper at 2.60, with a 2.62 stop.

The reaction to GDP so far has been encouraging, with futures traders not buying the BS that the economy only shank at a 1% pace, since the surge in government spending gave it a phony boost. Since there is no P in government, why is government in GDP? GDP can go as high as the Feds want. All they have to do is spend and have the central bank monetize whatever bonds the market won’t absorb. This chicanery, plus inventory replacement, could bring a slightly positive number in Q3, ironically just as TTM S&P 500 earnings go negative for the first time since they started keeping records in 1936.

I see no reason to change my guess that the end of wave 2 is nigh. I have been thinking since spring that 1050 or September, whichever came first, would be the signal that the top was in. It could be in already, but don’t expect things to drop off a cliff right away. A wave of this magnitude rolls over slowly, with plenty of smaller breaks and rallies before the trend has solidly reversed.

Keep an eye on the credit markets. When fear comes back in earnest, corporate bond spreads will break their relentless slide downward, and short to intermediate term Treasuries, if not the 10-year and 30-year, will signal a renewed flight to safety.

Treasuries could have a lot of strength left.

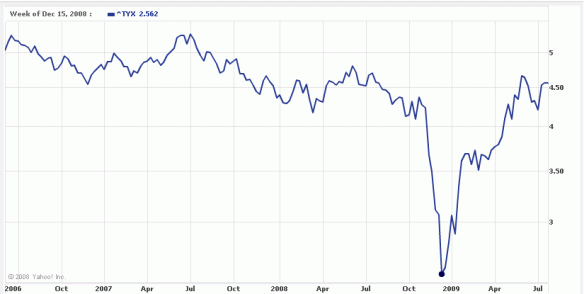
Take a look at this spike in the long bond yield in late 1979 and early 1980 (charts from Yahoo! Finance):

-
It must have been a real shocker at the time, and when yields returned to near pre-spike levels, it must have seemed as though the event were an anomaly. Well, it was part of a generational bottoming process for bonds that lasted a few more years:

-
Now take a look at recent history:

-
I’m just sayin’…

The bears capitulate

I usually am not so sure about things, but the markets are looking very stretched at the moment. Sentiment among bears is of capitulation. Everywhere I go on the blogosphere, I see posts and comments about how the market is rigged by Goldman or repo desks or the PPT, and that trading against robots is a no-win situation. I hear that fundamentals don’t matter, that the bulls are in control, that the transports have confirmed the industrials, that China will drive copper the moon and still buy it all, yada, yada, yada. The upshot is that traders seem to think that the bears will be totally crushed no matter what.

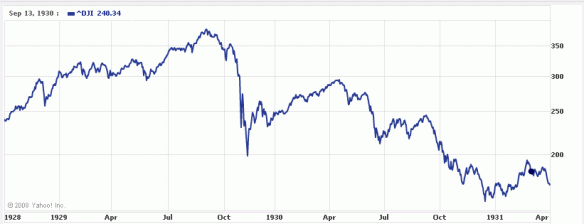
Well, what exactly have the bears experienced during the 50% rally from March 6 to today? I’d say that is about as severe a drubbing as you can take in the market, the polar opposite of what the bulls got last autumn and winter. It is time for a reversal, and not a small one. This is Spring 1930 all over again:
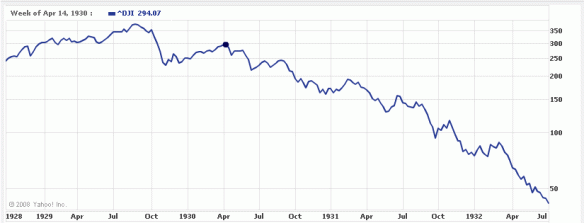
Above chart of the Dow Industrials from Yahoo!

-

Everybody has seen these before, but here are a few quotes from that post-crash reprieve:

December 28, 1929
“Maintenance of a general high level of business in the United States during December was reviewed today by Robert P. Lamont, Secretary of Commerce, as an indication that American industry had reached a point where a break in New York stock prices does not necessarily mean a national depression.” — Associated Press dispatch.

January 1, 1930

RESERVE BANK AREAS FORECAST NEW YEAR
Despite the obvious slackening of the pace of business at the close of the year, leaders in banking and industry throughout the country maintain an optimistic attitude toward the prospects for 1930.
January 13, 1930
“Reports to the Department of Commerce indicate that business is in a satisfactory condition, Secretary Lamont said today.” – News item.

January 21, 1930
“Definite signs that business and industry have turned the corner from the temporary period of emergency that followed deflation of the speculative market were seen today by President Hoover. The President said the reports to the Cabinet showed the tide of employment had changed in the right direction.” – News dispatch from Washington.

January 24, 1930
“Trade recovery now complete President told. Business survey conference reports industry has progressed by own power. No Stimulants Needed! Progress in all lines by the early spring forecast.” – New York Herald Tribune.

March 8, 1930
“President Hoover predicted today that the worst effect of the crash upon unemployment will have been passed during the next sixty days.” – Washington Dispatch.

May 1, 1930
“While the crash only took place six months ago, I am convinced we have now passed the worst and with continued unity of effort we shall rapidly recover. There is one certainty of the future of a people of the resources, intelligence and character of the people of the United States – that is, prosperity.” – President Hoover

June 29, 1930
“The worst is over without a doubt.” – James J. Davis, Secretary of Labor.

July 6, 1930

‘BUSINESS CYCLE’ SEEN AT NEW PHASE; Bankers Hold Downward Trend in Markets Indicates Recovery Is Near. DENY ANALOGY TO 1920-21 Economists Point to Superior Credit Conditions Now, Holding Easy Money Points to Revival.

August 29, 1930
“American labor may now look to the future with confidence.” – James J. Davis, Secretary of Labor.

September 12, 1930
“We have hit bottom and are on the upswing.” – James J. Davis, Secretary of Labor.

-

The bears were down but not out in June, and quite a few armchair traders jumped in to have another go at the fast money they found when they jumped on board the sell train in October and February. Well, 100 points in about 12 trading days left them flabbergasted, and toasted more than a couple of levered accounts. When traders are flabbergasted, they tend blame manipulation, and concluding the game is rigged, all but the gamblers bow out.

Well, this trader is not flummoxed. I’ll freely admit traded this rally poorly by thinking I should only buy at 620 and then not jumping aboard when we took off on huge breadth and volume from 666, and then by shorting high-flying junk and starting to buy my long term puts too soon, but I can chalk those up as trading school tuition fees. Nothing that has happened this year should surprise anyone these days, when it is so easy to look at 80 years of daily Dow closes on Yahoo. If this is 1988 and not 1930 I will eat the Tom McKans my wife hates so much and take up a respectable profession like welding.

Speaking of 1987 and expectations for a depression, Trader, the cult documentary on Paul Tudor Jones, is finally up on Youtube. People were recently paying $1000 bucks for this thing on VHS. I can’t say that it is worth that kind of dough, but it is definitely worth an hour of your time to watch one of the contemporary greats in his element as he trades what he thinks is the analogue of 1928-29.

UPDATE: Trader is gone. The producer had it taken down. But, it is still out there if you know where to look… a certain renegade financial site has posted a link. I’ll leave it up to readers to figure out which.

Some thoughts on the bear market.

This post started as an email that got way too long. I added some charts and put it up here:

The rally has not surprised me (on March 31 I expressed the opinion that we would hit 900 or higher by summer:

…more likely in my mind is a protracted rally extending to 900 or higher by summer, then rolling over to meet a date with 400 next winter. Look at last year’s rallies from March to May and July to August for an idea of what this might look like, though on a larger percentage and time scale because we are correcting a larger sell-off. The case for such a move is bolstered when you hear major investment banks’ strategists calling this a dead cat bounce. Too many people are still afraid to call a bottom, and they need to be suckered into long positions before this is over (along the same lines, too many traders are embracing the dead cat bounce and need to be shaken out before it can get back to leading the buy-and-holders to slaughter).

That said, I was leaning closer towards 900 than 1050:

I am highly skeptical, though respectful, of calls for a the mother of all bear market rallies. Robert Prechter and some other Elliott Wavers, as well as Tim Knight (slopeofhope.com) seem to be anticipating a 6-month or longer rally to as high as 1050. I simply don’t see why that is necessary in this environment. This is a depression, and the last one was accompanied by bear market that, after the first 6 months, maintained the momentum of a cruising supertanker. Rallies of 20 percent and 2 months were about all you got from April 1930 to July 1932 as the Dow dropped from about 295 to 41. That deflation-driven event was a much more orderly bear market than the jagged trajectory of the dot-com crash, which occured while the credit bubble continued to expand. Interestingly, the 1966-1982 secular bear (a brutal 75% loss in real terms) also traced out such a series of steep plunges and rallies as the bubble kept inflating thanks to a compliant Fed and the abandonment of the last trace of the gold standard. Employment was down, but animal spirits were still running high with the computing boom, the advent of securitization, and new innovations in consumer credit.

Though I saw this rally coming a mile away, I have traded it very poorly. First, I put too much emphasis on picking the absolute bottom for a buy-in.  Back in Feb and March I got out of most of my shorts by the time we were under 700, and I entered a bunch of limit orders to put over 1/2 of my net worth in SPY on the long side. Unfortunately, those orders started at 620, and we bottomed at 666. So I missed the bounce, and not only that, starting in April I began to short the junk stocks that were flying the highest and have been the real driver of this market. That was way too soon, and they kept on going, to the surprise of many a long-short fund as well. The outperformance of junk was a surprise, but the overall bounce has not been. When you have mood as compressed as it was back in March and you reach an exhaustion point after 18 months of a strong bear trend, you get a big reversal, which can then generate the extremes of optimism needed to set up the next plunge.

I’ve been buying long-term puts on the S&P and Nasdaq again since late March (way too soon, considering that I expected the rally to continue). I bought a bunch more yesterday, by the way. I view it as extremely unlikely that this market doesn’t decline to the point where solid value offers support — that would be a sub-10 PE and dividend yield of over 5% on dividends that have to fall by 50% or more from here to around $12 for the S&P. That would be the 240 level, but it should take at least a couple more years to get there (or below), if not four or five.

What has always worried me as a short in this market is not a 5-8 month rally, but a 12-18 month affair  like some of those that Japan has experienced in its long bear market since 1989:

Source: Yahoo! finance

That said, Japan’s financial sector was deflating while exports were improving, families had savings and the rest of the world was growing. Today’s situation is much, much more severe of course, and we can only find a parallel in the Great Depression for so many of the economic trends we are seeing. The longest bounce in that bear market was 5 months, and it was of similar magnitude (48% from Nov. ’29 to April ’30; we’re up 47% in the 4.5 months since March 6).

This is the Dow from 1928 to 1931:

Source: Yahoo! finance

And here’s how that bounce looked from 1933:

Source: Yahoo! finance

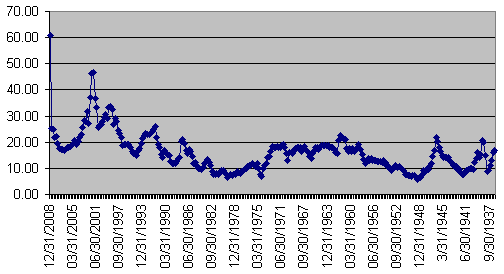
The S&P500 is now the most overvalued in history by PE (infinite as of this quarter’s running 12 month total, or a dot-com-esque 32 times current annualized earnings levels, about $7.50 per quarter). The dividend yield is about 2.5%, but dividends are nearly as high as earnings right now, which is completely unsustainable (they should be less than half of earnings). On a sustainable basis, the yield is 1.0 – 1.25%.

Here is the S&P PE ratio (TTM data through 12.31.08) going back to 1936. (the dates read right to left, since I can’t figure out how to reverse them in Excel). Data through 6.30.09 would be off the chart:

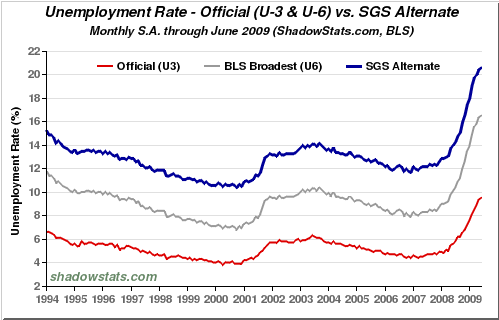
Real (U-6) unemployment is approaching 17% and climbing, and that is if you exclude the likely 6 million illegal immigrants who are out of work now (who used to take home $100 per day as construction cleanup boys or dishwashers). Throw them in, as we would have in the 1930s, and you get a solidly depressionary 20%.


Credit is still being withdrawn everywhere you look, whether in home equity, credit cards or small business loans. There has been a bounce in the corporate bond market, but that is due to the same technical forces that are driving the stock market, and the big bankruptcies are just beginning. Only the very weakest have gone under so far, like the car companies.

So with this backdrop, I don’t expect this summer’s good feelings to last into the holidays. The markets should start to roll over again soon, since the big-money value investors needed for a sustained advance can find no reason to buy in, and the little guy has been burned too many times to chase this market very far. Volume is very thin, and an unusually large fraction of trading is taking place between automated programs.

When the data to back up the green shoots theory fails to show up after another few weeks or months, and even official unemployment is solidly into the double digits and climbing, while another huge wave of mortgage resets hits the middle class, there will be no hope at all left to support this market, and it will slide to levels not seen since George Bush Sr. was in office.

It will then still not be a safe long-term buy. For that, considering all of the obstacles that the government has created to profit-making, we need to get back to Reagan-era levels, somewhere under the bottom of the 1987 crash.

S&P500:

Source: Google finance

That old-time feeling…

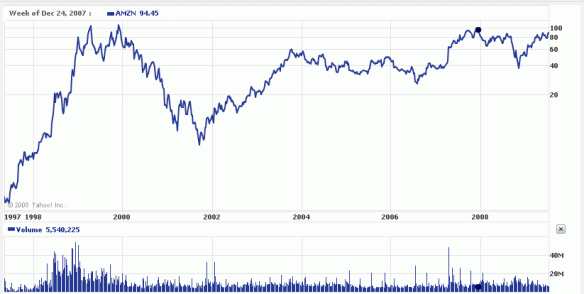
Robert Prechter said back in February that some aspects of this bounce would resemble the euphoria of the all-time top in equities. Well, when I looked at the market today and saw that Amazon has rocketed up to its 2000 and 2007 peaks (albeit on pathetic and waning volume this go-around) and sports a 60+ PE, I got a tingle of that giddy feeling I had when I was buying puts hand over fist on stocks like this two years ago. Back then the whole market looked like this, but there are some great set-ups being formed this summer.

We are now solidly overbought as well as ridiculously overvalued. We may be witnessing the last gasp of the great post-1995 equity bubble.

Source: Yahoo! Finance

-

A word of caution: when the NASDAQ runs like this, it can keep on going for weeks, so don’t get run over going short-term short. This kind of momentum should drive the VIX under 20 before long. That would signal near-total complacency in the face of economic fundamentals whose only parallel, and there can no longer be any dispute here, lies with the Great Depression: link to pdf from Sprott Asset Management.

With every new low in the VIX, I buy more puts

Still in favor are Dec 2011 SPY LEAPS of various strikes, and today I’m eying market darlings Apple and Goldman. The chatter on these two being recession-proof is reaching a fever pitch, and while there is a kernel of truth to that story, their stock prices leave no room for error at these levels. Actually, even if these companies continue to prosper, their stocks will deflate as the market assigns lower multiples to the earnings of its strongest as well as weakest components.

REITS (proxy IYR) can’t hold up much longer either, their short-squeeze having run out of steam while rents start to plummet in earnest.

The question of the summer is how high this market will go while the global reprieve in mood lasts. That the NASDAQ is leading the pack reminds me of late 2007, when the market had started to roll over but the “tech horsemen” (AAPL, RIMM, AMZN, GOOG) kept on rising, against all reason. The fact that it has already reached such heights is a big warning sign. It has almost filled its October gap, a very nice target for a corrective bounce.

Above chart from google finance. BTW, check out wikinvest if you get a chance. It’s got a lot over google and yahoo’s stock pages.

Elliott Wave theory holds that corrections move in three waves (impulse moves in five), so this current push could be viewed as the C-wave in an A-B-C move. When it exhausts, a sea change may ensue, not just a minor reversal. With no fundamental support above SPX 400 (and weak support there), just such a paradigm shift is very much on the table.

Ron Paul sums up the crisis in 3 minutes

(thanks again to zerohedge for finding this video)

I remember when I first discovered a speech by Ron Paul back in boom-time 2005, and was shocked that a Congressman was so eloquently warning of the dangers of fractional reserve lending, the Federal Reserve system, and welfare/warfare deficit spending. It was the first time that I could fully respect a standing politician.

Dr. Paul is still the nation’s strongest voice for an honest monetary and banking system, and he delivered a zinger in front of Bernanke and Frank yesterday. If, like me, you haven’t heard him speak in a while, have a listen and you’ll remember why his campaign was so exciting for so many of us.

Money quote: “I would suggest that the problems we have faced so far are nothing compared to what it will be like when the world not only rejects our debt, but our dollar as well. That’s when we’ll witness political turmoil that will be to no one’s benefit.”

-

Now wouldn’t it be great to have Peter Schiff to cause the same trouble in the Senate?

Reflation fade vindicated

Today’s action (equity and commodity sell-offs through key levels, major bond and dollar rallies) confirms once again that the dollar is still king and that deflation is the name of the game.

The action since March can be summed up as (1) a dead-cat bounce from oversold conditions in equities, (2) a replay of early 2008′s speculative rally in commodities, and (3) premature fears of the dollar’s demise.

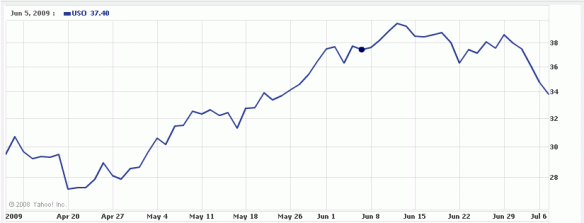
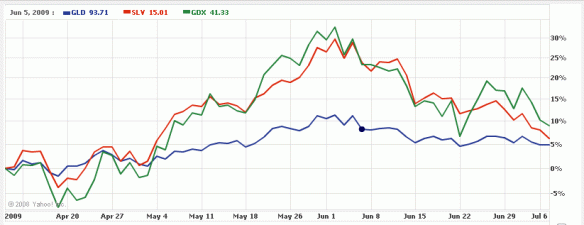
The charts below show how things have played out since I noted the following on June 5:

Well, the reflation trade has managed to hold on for a few more days and even reached new heights, but the case for a pullback is looking that much better. Precious metals, non-dollar and non-yen currencies, oil and treasury yields have all benefited from what looks like a fairly extreme fear of inflation. …

From this juncture, I am still more enthusiastic about the prospects for the dollar, bonds and related commodity shorts than I am about stock market shorts, since the sentiment in the later has not reached the same levels of broad consensus. That said, it would be surprising if we don’t at least stop making new highs for a few weeks, if not fall well under 900 in the S&P.

This trade has gone well so far, but a bit over a week ago I had very large shorts (with futures) on the euro, pound, franc and oil, in addition to my large equity, copper and gold shorts, but the former made a little pop to new highs that stopped me out. I put on some more pound and franc shorts, and retained some puts on oil, but I’m kicking myself for being such a wimp with tight stop prices. My excuse for not re-shorting in bulk is that I was about to move for the summer and wouldn’t have much screen time again for a while.

I am also guilty of getting cute and taking profits on my silver futures short (from 15.75) at 13.92 and not re-shorting at 14.40 when I had the chance, though I have thought all along we are going well under $10. Nonetheless, today was a good day, and squiggles notwithstanding, I think we have turned the corner here.

Here are a few three-month charts from Yahoo! to show how things have gone so far (the little dots are placed on June 5 (actually I first said to fade the reflation trade on May 28):

S&P500:

-

The dollar vs. the euro (not much action so far, but certainly no dollar flameout):

-

USO (United States Oil Fund):

-

Precious metals complex (GLD, SLV and GDX):

-

30-year Treasury bond yield:

-

Even grains have sold off hard (DBA agriculture fund):

-

Now, we’ll see if this is just a setback from premature extremes or if we’re headed for new deflationary lows in a hurry. I think the reflation trade has topped, but that doesn’t mean equities can’t make a last ditch effort to stop out the shorts with new highs. That said, I’m sitting on a big load of index puts.