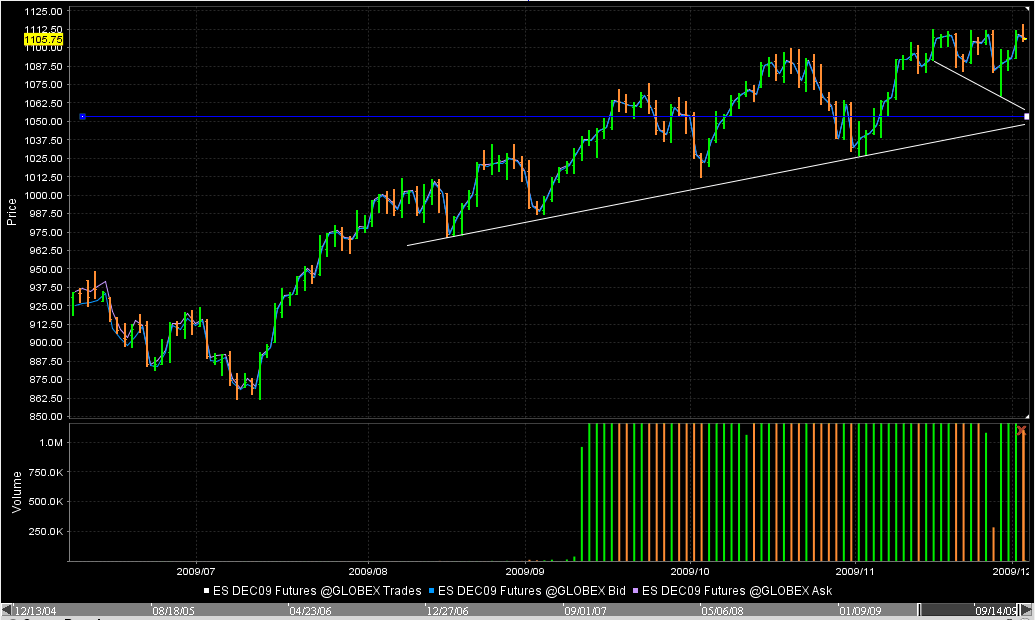
Here’s a 6-month shot of the S&P500 futures:
Source: Interactive Brokers
Looks like another good short set-up here, using a couple of points over today’s high as a stop and 1055 as a target (with much greater bearish potential of course). Like many bears, I’ve been expecting the 2009 rally to peter out since summertime, and I’ve been continually surprised by the stock-buying public’s recklessness, delusion and plain stupidity as evidenced by a PE ratio well over 100 in the face of 10%+ unemployment, shrinking credit, and accelerating foreclosures and bank failures.
That said, the market since summer has given us a series of fairly clear short-term sell signals and has obeyed them with a series of 4-6% declines. Unlike previous rallies that powered through resistance into solid new highs, the rally since the latest interim bottom (November 1-2) has stalled out well within the price range of the previous top (mid-October). Not only that, but the distribution (choppy) pattern within this three-week plateau has exhibited a much wider range than previous ones. Might this instability indicate a pending phase shift, such as when a top gets wobbly before toppling over?
Oil
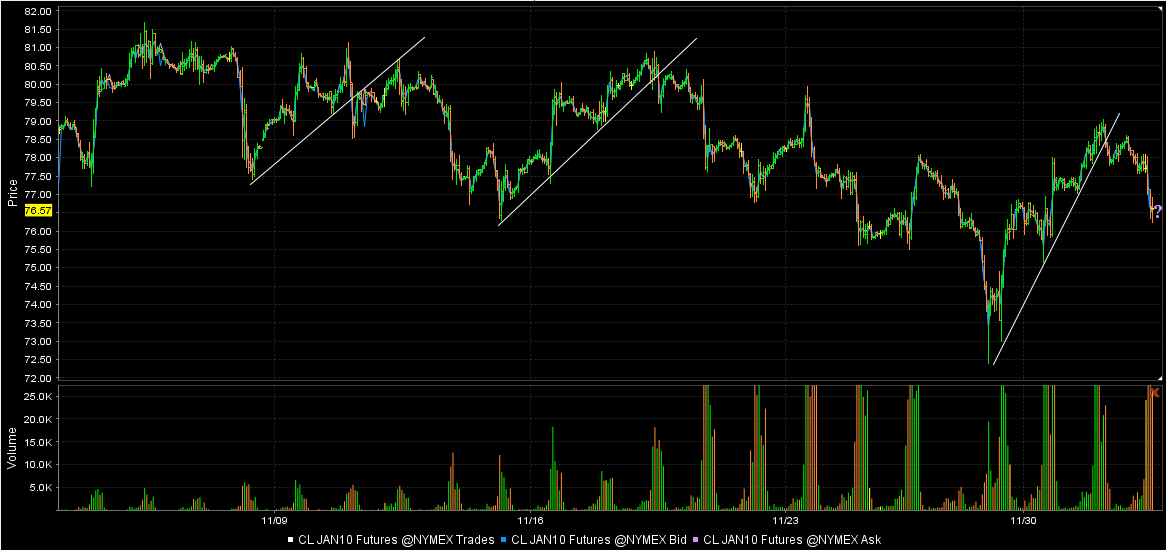
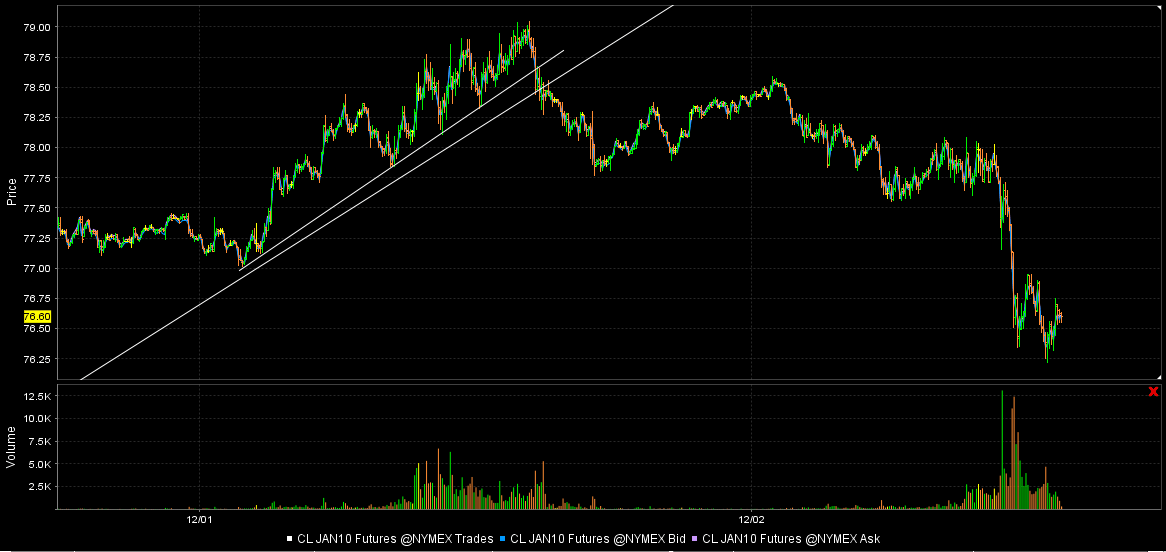
I want to show some basic charting here with crude, which is supposedly falling because of the supply report today, an explanation that I consider hogwash. Rather, the chart offers some examples of a very simple sell signal: the broken trendline. Yesterday’s signal was classic: it broke a very clear uptrend at a couple of different degrees, attempted a re-test, then fell hard.
-
Here in the 2-day view you can see the smaller trend and how its break lead to the break of the larger one:
-
This reminds me of last week’s mini stock panic, which was supposedly because of Dubai World. Funny thing is, as EWI noted, stock futures made their high a few hours after Dubai made its announcement.
One Response to “Choppy & toppy”
Leave a reply
Most Viewed Posts
- Add mortgages to the debt bubble (with junk bonds, munis, sovereign debt…) - 17,406 views
- Treasury-only money market funds - 15,242 views
- The next bubble: cash. - 14,512 views
- 90 day T-bill rate drops to 0.23%. What’s next, negative yields? - 11,997 views
- Inverse ETFs vs. LEAPS puts - 11,062 views
- Why bailouts will not stop the depression - 9,527 views
- About - 8,782 views
- Listen to the people who predicted this: No bailouts, no New Deal, no serfdom. - 8,184 views
- Commodities bubble bursting - 7,755 views
- On Black Thursday, 1929, the Dow closed down 2%. - 6,973 views
Recent Posts
- Nov 24, 2011 - Why not sell German bonds?
- Nov 22, 2011 - Investable wine index down in 2nd half of 2011, as in 2008
- Nov 21, 2011 - Where are we in the secular (post-2000) bear?
- Nov 21, 2011 - Ignore all this supercommittee talk
- Nov 21, 2011 - Ron Paul: Return to 2004 budget would eliminate deficit right now.
- Nov 16, 2011 - Are there any good buys emerging in Greece?
- Nov 11, 2011 - Great little speech at EU: fire the bureaucrats & restore national sovereignty
- Nov 11, 2011 - Americans love war
- Nov 9, 2011 - Hussman: recession imminent
- Sep 20, 2011 - EBT rap video
- Sep 11, 2011 - Dick Cheney’s favorite holiday
- Aug 19, 2011 - A look at the real value of gold on an historical basis.
- Aug 18, 2011 - The material living standards of US rich vs poor, and the politics of envy.
- Aug 11, 2011 - In candid moment, Bernanke lets out the truth
- Aug 11, 2011 - If S&P’s downgrade actually matters, why are bonds up?
Recent Comments:
- Where are we in the secular (post-2000) bear? - Mike: Well, if you hold equities in a cash account, I would not...
- Are there any good buys emerging in Greece? - Mike: Hi Bjorn. I honestly don’t have a conclusion one way or...
- Where are we in the secular (post-2000) bear? - Bjorn: “. . . select equities could be a nice hard asset to...
- Are there any good buys emerging in Greece? - Bjorn: I’m somewhat off topic here, but I wanted to run this by...
- A look at the real value of gold on an historical basis. - GolfBoy: Never mind - found it here:...
- A look at the real value of gold on an historical basis. - GolfBoy: Please, anyone - what is the historical...
- EBT rap video - Quentin Perrin: Hi, Sorry I write you via comments. But I could not find contact e-mail or feedback...
- EBT rap video - Linus Huber: SCARE 20.12.2012 (Stop Corruption and Repression Effective 20.12.2012) Banks were given...
- EBT rap video - steveo: Hawaii Trading and Breakpoint Trades (BPT) is providing a free newsletter on Commodities....
- At last, NYC rental and condo markets softening - Nicole Cervantes: Does any one know some one using web fame service...


Aki_Izayoi
December 3rd, 2009 at 5:08 am
Here is another sentiment indicator:
http://www.gallup.com/poll/124247/Americans-Rate-Lives-Hurting-Work.aspx
Perhaps the happiness set point theory at work? Perhaps once the shock was over people reverted to their normal happiness levels?
Well, it seems we are almost ready to short.