Dow update: one more low ahead?

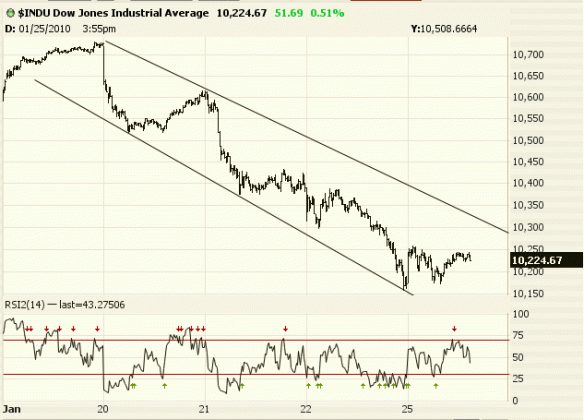
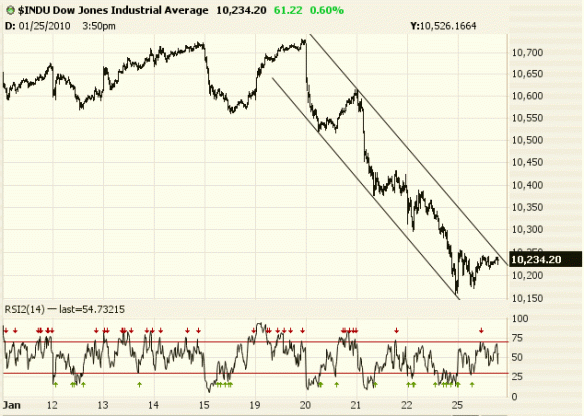
We’ve gone sideways for long enough now to reset things for a new low, should the markets choose (futures made a new low overnight, by the way). The channel has been violated, but these things are not sacrosanct. Waning upside momentum around the 10,250 level suggests we could be setting up for another decline.

Source: Prophet.net

-

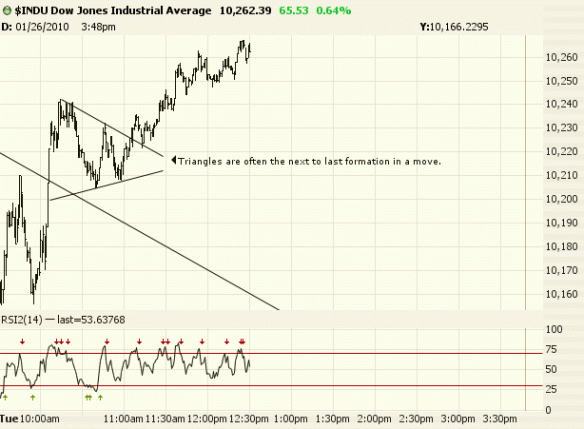
Here’s a close-up of today’s move, showing a contracting triangle that indicated stocks were going to break upwards, since the move out of a triangle is usually in the direction of the existing trend. Such triangles often precede the last move in a sequence, so I’m looking for exhaustion here.

-

Of course, if stocks accelerate upwards from right here, all bets are off.

Platinum update

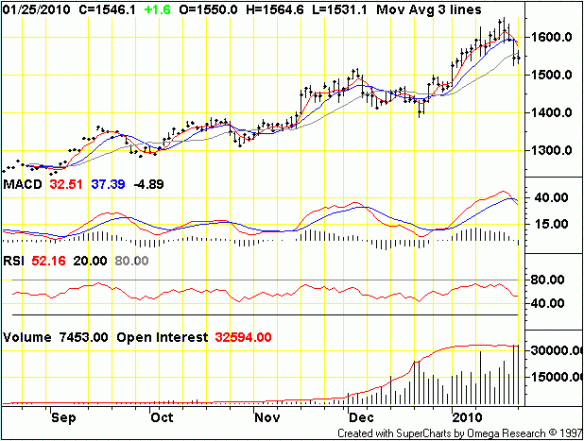
The MACD on platinum’s daily bar chart is giving a sell signal:

Source: futures.tradingcharts.com

-

Platinum prices and sentiment charged ahead and made a new high a week ago as gold tried to get its mojo back and failed. When the metals complex turned lower, platinum fell hardest, a cool 100 bucks in two days. All of this talk about cars in China is swell, except that they are the only growing auto market these days and even their debt bubble is bursting. And besides, that stuff isn’t tradable information anyway. The fact is, platinum may as well be gold most of the time, since the precious metals move together with a very high degree of correlation.

Sugar high

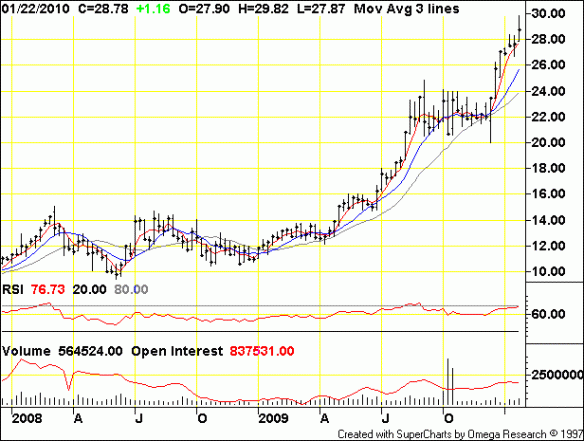
Traders are very bullish on sugar right now, so keep an eye out for a top. In Elliott Wave terms, this should be the fifth and final wave of the bull market. The 3rd wave, the most powerful advance in which most traders recognised this as a bull market, ended last summer. The contracting triangle sideways correction this fall was very likely a 4th wave, since this triangle is often the next to last pattern in a sequence.

As a commodity, sugar is prone to extended 5th waves with crazy spikes. Look at this post from last month with a sugar chart from the ’70s.

Anyway, here is today’s weekly bar chart:

Source: futures.tradingcharts.com

-

Trader sentiment is a funny thing. People were crazy about sugar last summer at 24 cents, but by November four out of five didn’t want it at 22 cents, and now nine out of ten love it at 30 cents. Makes no sense unless you think of them as a bunch of herding animals.

-

Dow channel

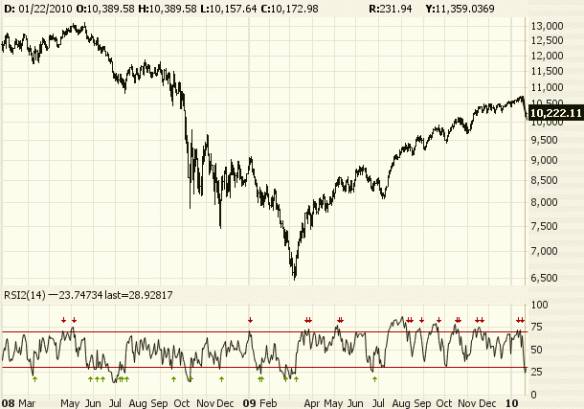
It wouldn’t surprise me to see stocks drift down here and make a new low, though on a diverging RSI without a new high in the VIX. We had a very swift move last week, so Elliott wave 3 should be behind us, and the next low could set us up for a 200-300 point bounce. You could also make the case that we’re already primed for one, with daily RSI oversold here.

Source: Prophet.net

-

EDIT (2:45PM EST) – I like this channel better:

-

On a larger scale of course I think the decline is just starting.

-

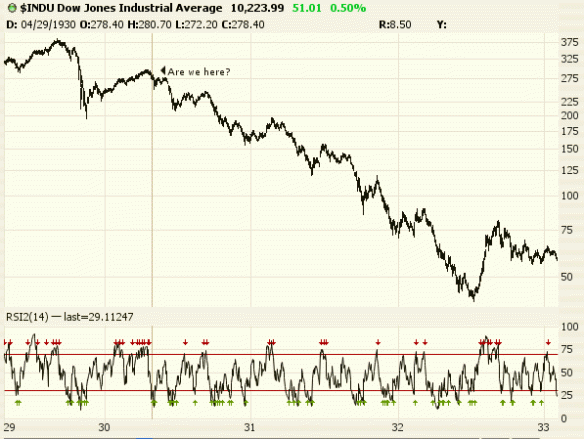
Here’s how the Dow did in the last deflationary depression. Best move was to get short and stay short, since all rallies after the first big one were quick to peter out.

Congratulations Daneric

There has been a lot of Elliott Wave bashing this year in spite of Prechter’s late February 2009 call for a rally from SPX 700 to the 1000-1100 area, and his call for maximum levered shorting about a week ago (he called for a 100% short position at about SPX 1020 in August), as well putting a sell on the long bond just before it collapsed under QE last spring, and recommending longs on USD late this summer and fall.

A lot of bears are fans or subscribers, and a lot of them lost money in 2009. Naturally, when they made money in the crash it was on their own brilliance, and what is a newsletter for if not to excuse your losses? But really, if you went 100% long SPX at 700, went 100% short in August and 200% short last week, you’d be up about 36% in under 12 months (after at least doubling your money from going “short with maximum leverage” in July 2007 and covering last February 24.

I do occasionally have nits to pick with EWI, but the bashing they get these days is just nonsensical. Who else, besides Prechter and Mish (and I harbor a suspicion that Mish learned about the credit cycle in part from reading Prechter) called for deflation while the bubble was raging?

At any rate, EWI is not the only game in town. Daneric has actually been more accurate in his medium/short-term calls than Hochberg over the last several months, and he posts every day for free. He suspected even as late as November that the top was not in, and that stocks would drift over 1100 on a sinking VIX before possibly topping out in January. Bravo! He counted the ending diagonal this month, said it looked finished a week ago, and on the evidence of this week’s decline is now finally calling Primary wave 2 over.

Who cares which sock puppet is Fed chairman?

So Barbara Boxer and Russ Feingold are against Bernanke… good for them, but it doesn’t make any difference which egghead reads the February and July speeches to Congress when the very existence of a central bank is the problem.

Here’s what should be done with the Fed:

-

See also: Greenspan was framed! Blame bankers’ moral hazard, not their lackey.

Suddenly, everyone wants puts!

Gee, who would have thought?

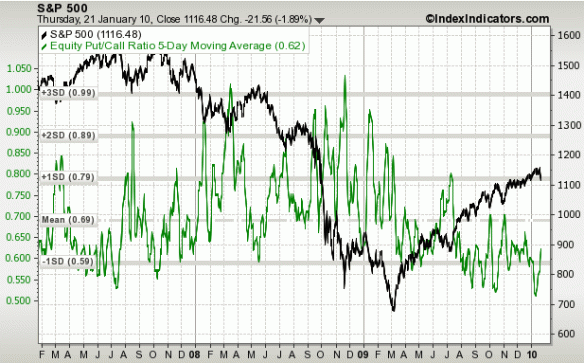
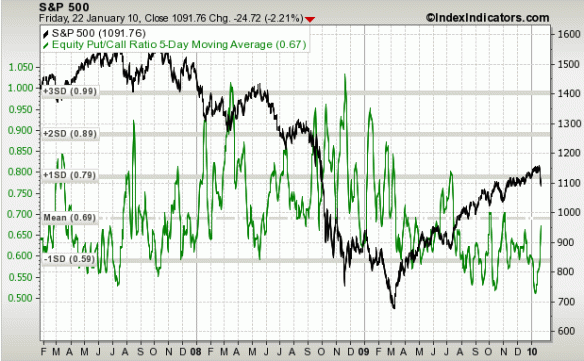
Here’s the trusty 5-day trailing average equity put:call ratio as of Thursday’s close (for some reason, indexindicators doesn’t update this until the next morning). CPCE doesn’t give sell signals like last week very often, but when it does, SELL!  BTW, Friday’s closing CPCE print was 1.05, so this thing has really rocketed up now.

Source: indexindicators.com

This translates into some serious price changes, even on long-term options. The SPY 90-strike December 2011 puts I favor are up 40% in just a few days. I’ve also written a whole bunch of March-Sept 2010 calls on stuff like QQQQ and DIA. That’s a great way to make some income, since even if the market doesn’t crash, so long as it doesn’t keep blasting upwards the time decay is money in your pocket.

-

UPDATE. Here’s the chart as of Friday’s close. I bet we don’t bounce hard until the 5-day average gets at least 1SD above the mean. And look at the swiftness of this week’s drop in SPX… this is a more powerful decline than any since last winter.

The tables are turning, and panic is on the way back.

I was extremely, almost uncomfortably short for the last couple of weeks, and with the Dow down 175 a few minutes ago, I covered my stock futures shorts and bought a few contracts to hedge up my long-term puts. It’s looking very good for the shorts — dollar up across the board, bond spreads wider, and stocks and commodities down together. Classic deflation trade.

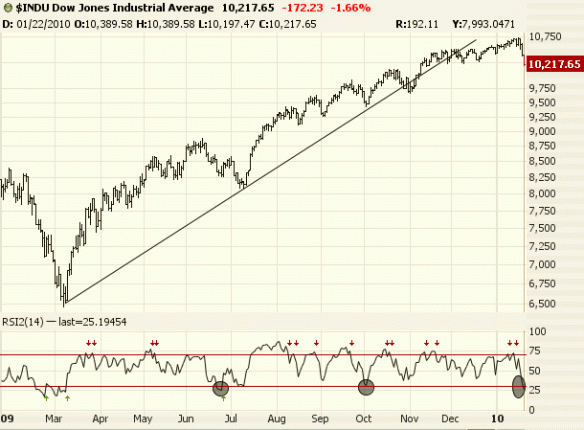
Here’s the Dow. You can see that RSI says we’re already into oversold territory on the daily bar, which indicates the power of this move. There could be a bounce here, but I think stocks are where gold was after it fell hard from $1228 last month: they can rally, but the high is in. Now the bulls will be the ones fighting the tape.

Source: Prophet.net

-

Of course, the rally taught us bears to go easy and hedge up after little sell-offs like this, but that is going to be a frustrating stragegy if we’ve turned. As with the euro since the dollar index put in its low, surprises will be to the downside. I suspect not even this initial move down is over yet, maybe just the most violent part.

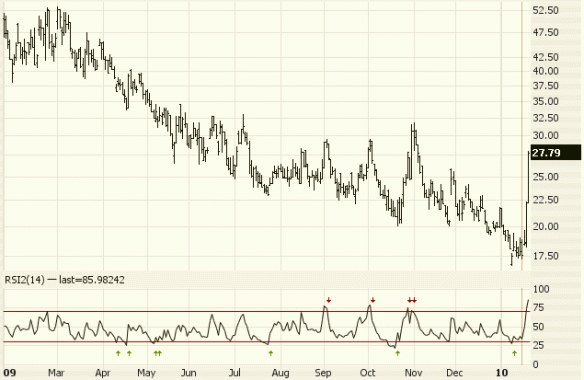
Take a look at the VIX. It has just blasted off – jumping over 50% in a week, most of it in just two days! This is giving us a very, very strong signal that panic is coming back, and in fact, was never very far off:

Another good week for bond spreads

Bonds are a key indicator of the health of the risk trade. So long as treasuries are shunned and junk is bid, it is likely that stocks and the commodity complex hold up. This week, long-dated Treasuries have gained a couple more points as junk bonds continued to lose their mojo:
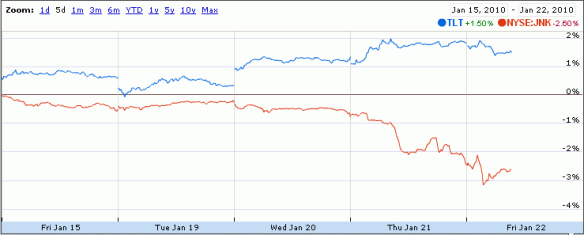
Source: google finance

Here are the same ETFs going back to the start of the bear market in stocks. You can see that despite a huge correction in 2009, treasuries are still over 20% ahead of junk:

-

The collapse of the long bond has been eagerly awaited since 2007, and TBT (the 2X short bond fund) is still often mentioned in online chatter. The crowd is almost never right about these things, so I suspect that T-bonds will remain strong for the next leg down in stocks.

2008 was just been the “first look” at what can happen in the aftermath of a debt bubble — why couldn’t the same price action continue as risk in priced in again? Even if 2008 turns out to have been the “Prechter point” of greatest recognition and panic (and not what is coming), I doubt that many final price extremes were set last year.

For the yeild on the long bond, at the very least I expect another dip into the sub-3.5% area (it’s 4.5% now, and it touched 2.5% a year ago). Then we can talk about setting up long-term short positions for a secular (15-30 year) bear market.

At any rate, if think yields are going up from here, you’ve got much better odds with shorting corporate or municipal bonds, since those things are priced for perfection and defaults are going to be rampant. Even if treasury yields stay flat or go up, weak credit should collapse.

Oh, and if you just can’t wait to short long-dated sovereign debt, how about Japan at 2%? Or Greece at 6%? Or Spain, Italy, Ireland… all of this stuff is in trouble. Why pick the senior currency?

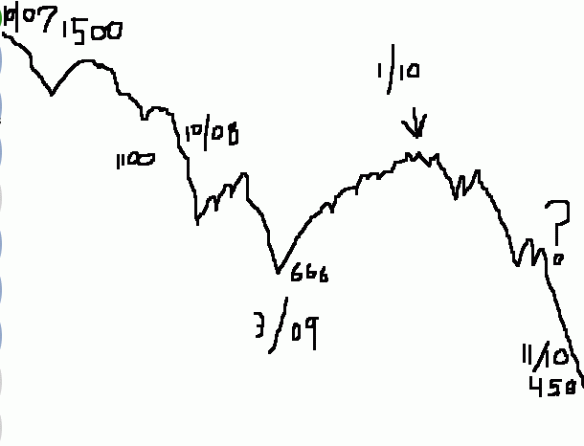
Some highly scientific projections

S&P 500:

That’s not a projection for a final bottom, by the way… that would be lower.

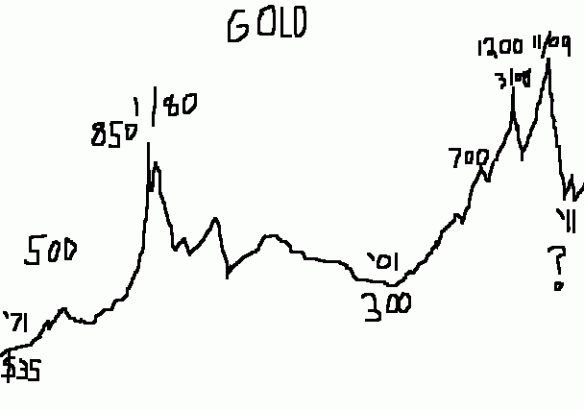
Gold, from 1971 (Richard ”I am now a Keynesian in economics” Nixon):

Note: Under Bretton Woods, the dollar of course was pegged at 35 to the ounce from 1933 to 1971.

Gold has been in a parabolic move since ’04, and the degree of speculative interest got high enough to call it a mania, just like every other asset class this past decade. It is money, though, so although I expect some frightful drops, on the whole gold will preserve your capital through the mayhem. The high inflation that everyone has thought is right around the corner since 2007 could actually happen several years from now after enough debt has been wiped away to end deflation. In that case, history says the best assets could instead be real estate (leverage!) and agricultural commodities (government-induced shortages). *Professor Jastram showed that gold, as a form of money, doesn’t do as well in real terms in inflation as most people think, though it sure beats paper money during high inflation.

Remember, 1980 – 2001 was an inflationary period. So was 2001-2008, so go figure — I figure gold did well in the latter inflation because there was a commodity mania. Since 2008 you could say it has been strong for the “right reasons” – financial panic and deflation. That said, it still gets ahead of itself and does tend to fall with other commodities when the margin loan department calls.

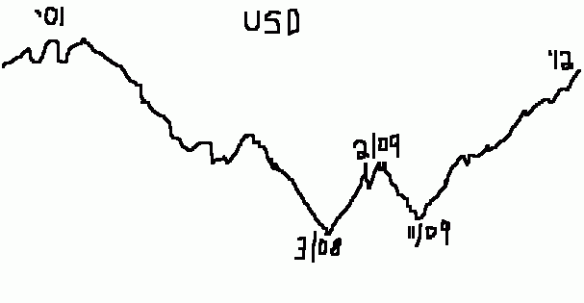
US Dollar Index:

More deflationary panic ahead — what’s so great about all the other fiat currencies? Why is everyone so afraid of the dollar? Answers: nothing, and because it fell for 7 years.

-

*Here is a free paper by Jastram I found on Scribd: The Behavior of Gold under Deflation