Who’s worse, Senators or Goldman traders?

Senators. Watching today’s hearing, I’m left with the impression that the politicians are megalomaniacal, hypocritical and ignorant. The Goldman guys are sharks, to be sure, but here they come across as pretty straightforward.

The Senators seem to just be fishing for sound bites, with very little understanding of what was actually going on in the mortgage business. Susan Collins seemed unable to grasp the difference between a market maker (a kind of trader) and an investment advisor, when she asked over and over again if these Goldman market makers had a fiduciary duty to their clients.

Now this guy Kaufman seems hung up on stated income loans, as if Goldman were wholly responsible for the loose lending standards of that era. What about the idiots running the multi-billion dollar endowments and pension plans who bought these securities? They were more responsible for the bubble than these middle-men, since without their willingness to buy anything with a yeild premium lending standards could not have gotten out of hand.

And what about the government-sponsored rating agency cartel? What about Fannie, Freddie and the Fed? FDIC, etc, etc.? This is just scapegoating as usual.

UPDATE, 4:50 EST:

I can’t believe it. I’m rooting for the Goldman guys over this blowhard from Detroit, Carl Levin, and the rest of these ignorant hypocrites.

Foot-in-the-mouth comment from CFO David Viniar just now, in response to Levin’s question about how he felt when reading those old emails: “I think it’s very unfortunate to have that on email.”

I’m actually surprised that Goldman wasn’t better about controlling email. Why allow any of this stuff to be put in emails, and to retain them? What’s wrong with the proverbial smokey room?

The more I watch, the more peeved I get about the general thrust of this witchhunt. Goldman was a middleman and a trader, that’s it. They sold these products to very big money players. Those guys were the negligent ones, where the real blame lies, along with the government and central bank that fueled this blaze with moral hazard.

Forget GDP. Tax revenue tells the real story.

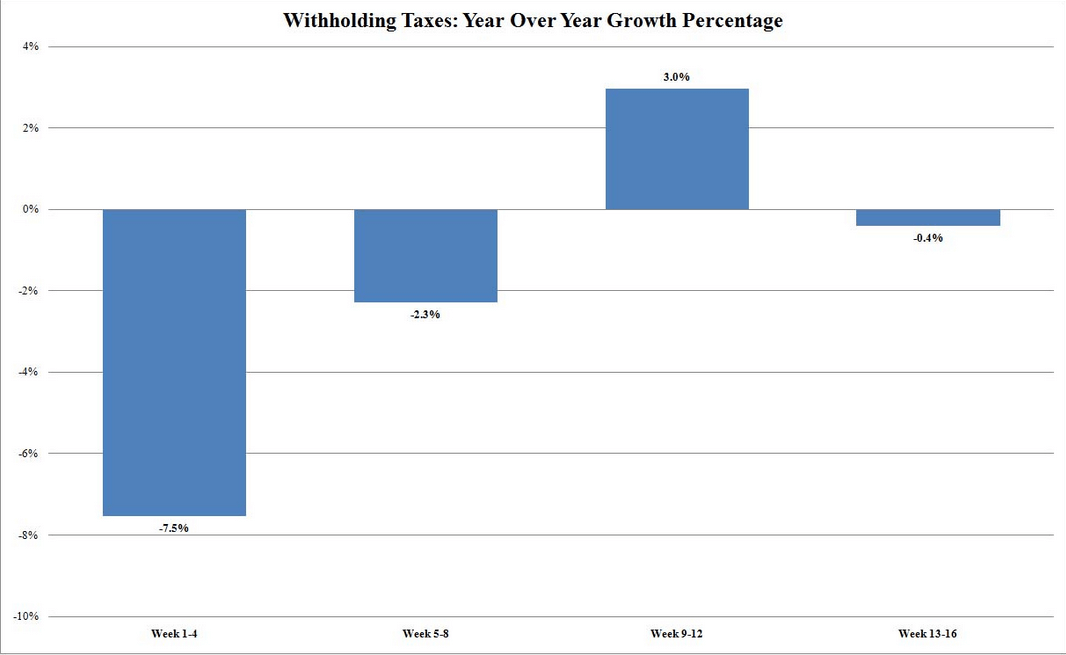
Mish often points out that state sales taxes are flat to down year over year, even though rates are up, revealing that the recovery is all smoke and mirrors. Zerohedge has been reporting the federal income tax withholding data, which tells much the same story. Basically, if the economy were really improving, people would be earning more, spending more, and paying more taxes. Government spending is not economic growth — if it were that easy, the USSR would still be around.

Here’s the latest withholding data from zerohedge:

The Fox in the Henhouse

Wepollack on Youtube has a succinct little video explaining the type of person who thrives within a hyper-regulated crony capitalist system (this is about the US, but could be the UK, Europe, Australia, Japan, Russia or just about anywhere with a highly developed government):

-

One piece of the equation he left out was academia. Plenty of these weasels (Ben Bernanke, Larry Summers) occupy university positions at various points in their careers, and while students they soak up Keynesianism, socialism and theoretical justifications for everything the government does.

Analysts and institutions: stocks “extremely cheap” despite 1.7% yields after 80% rally. Hussman & Prechter: another crash likely.

Bloomberg today gives a tour of the bull camp, which believes in a V-shaped recovery and soon-to-be record S&P earnings:

Even after the biggest rally since the 1930s, U.S. stocks remain the cheapest in two decades as the economy improves…

…Income is beating analysts’ estimates by 22 percent in the first quarter, making investors even more bullish that the rally will continue after the index climbed 80 percent since March 2009. While bears say the economy’s recovery is too weak for earnings to keep up the momentum, Fisher Investments and BlackRock Inc. are snapping up companies whose results are most tied to economic expansion.

“The stock market is incredibly inexpensive,” said Kevin Rendino, who manages $11 billion in Plainsboro, New Jersey, for BlackRock, the world’s largest asset manager. “I don’t know how the bears can argue against how well corporations are doing.”

S&P 500 companies may earn $85.96 a share in the next year, according to data from equity analysts compiled by Bloomberg. That compares with the index’s record combined profits of $89.93 a share from the prior 12 months in September 2007, when the S&P 500 was 19 percent higher than today.

Those figures would be for operating earnings, not the bottom line. In recent years it has been increasingly common to simply call operating earnings “earnings” and to imply that multiples on this figure should be compared to historic multiples on the bottom line. Ken Fisher, readers may recall, was running obnoxious video web ads through 2007-2008 touting a continued rally just before stocks fell off a cliff. His equity management firm makes the most money if people are all-in, all the time, as it collects fees as a percent of assets.

Record Pace

The earnings upgrades come as income beats Wall Street estimates at the fastest rate ever for the third time in four quarters. More than 80 percent of the 173 companies in the S&P 500 that reported results have topped estimates, compared with 79.5 percent in the third quarter and 72.3 percent in the three- month period before that, Bloomberg data show.

It is impressive how companies have protected themselves since the downturn began, but the way they have done this is by simply cutting costs, hence the stubborn 9.5% (headline U-3) or 17% (U-6) unemployment rate.

David Rosenberg, as usual, is the cooler head in the room:

Alternate Valuation

David Rosenberg, chief economist of Gluskin Sheff & Associates Inc., says U.S. stocks are poised for losses because they’ve become too expensive. The S&P 500 is valued at 22.1 times annual earnings from the past 10 years, according to inflation-adjusted data since 1871 tracked by Yale University Professor Robert Shiller.

Economic growth will slow and stocks retreat as governments around the world reduce spending after supporting their economies through the worst recession since the 1930s, said Komal Sri-Kumar, who helps manage more than $100 billion as chief global strategist at TCW Group Inc. The U.S. budget shortfall may reach $1.6 trillion in the fiscal year ending Sept. 30, according to figures from the Washington-based Treasury Department.

“The correction is going to come,” Sri-Kumar said in an interview with Bloomberg Television in New York on April 21. “You now have a debt bubble growing in the sovereign side, and we’re slow to recognize how negative that could be.”

We are still in the thick of the largest credit bubble in history. Consumer and real estate debt has yet to be fully liquidated (and hasn’t even started in China), corporate indebtedness is the highest ever, and now government debt has reached the point of no return where default is inevitable.

Equity is the slice of the pie left over after all debts are serviced, so to say that it is cheap when it only yields 1.7% (in the case of S&P dividends) is insane. It is much safer to be a creditor of a business than an owner, so debt yields should be lower than equity yields. In today’s perverse investment climate, even 10-year treasuries of the US and Germany yield more than twice equities.

This extreme confidence in stocks and dismissal of risk considerations further indicates that this is a toppy environment, highly reminiscent of 2007.

John Hussman explores this theme a bit further in his latest market comment:

As of last week, our most comprehensive measure of market valuation reached a price-to-normalized earnings multiple of 19.1, exceeding the peaks of August 1987 (18.6) and December 1973 (18.3). Outside of the valuations achieved during the late 1990′s bubble and the approach to the 2007 market peak, the only other historical observation exceeding the current level of valuation was the extreme of 20.1 reached just prior to the 1929 crash. The corollary to this level of rich valuation is that our projection for 10-year total returns for the S&P 500 is now just 5.3% annually.

While a number of simple measures of valuation have also been useful over the years, even metrics such as price-to-peak earnings have been skewed by the unusual profit margins we observed at the 2007 peak, which were about 50% above the historical norm – reflecting the combination of booming and highly leveraged financial sector profits as well as wide margins in cyclical and commodity-oriented industries. Accordingly, using price-to-peak requires the additional assumption that the profit margins observed in 2007 will be sustained indefinitely. Our more comprehensive measures do not require such assumptions, and reflect both direct estimates of normalized earnings, and compound estimates derived from revenues, profit margins, book values, and return-on-equity.

That said, valuations have never been useful as an indicator of near-term market fluctuations – a shortcoming that has been amplified since the late 1990′s. The lesson that valuations are important to long-term investment outcomes is underscored by the fact that the S&P 500 has lagged Treasury bills over the past 13 years, including dividends. Yet the fact that these 13 years have included three successive approaches (2000, 2007, and today) to valuation peaks – at the very extremes of historical experience – is evidence that investors don’t appreciate the link between valuation and subsequent returns. So they will predictably experience steep losses and mediocre returns yet again. Ironically, before they do, it also means that investors who take valuations seriously (including us) can expect temporary periods of frustration.

I’ve long noted that the analysis of market action can help to overcome some of this frustration, as stocks have often provided good returns despite rich valuations so long as market internals were strong, and the environment was not yet characterized by a syndrome of overvalued, overbought, overbullish, and rising yield conditions. In hindsight, the stock market has followed this typical post-war pattern, and we clearly could have captured some portion of the market’s gains over the past year had I ignored the risk of a second wave of credit strains (which I remain concerned about, primarily over the coming months).

It is important to recognize, however, that even if we had approached the recent economic environment as a typical, run-of-the-mill postwar downturn, we would now be defensive again, as a result of the current overvalued, overbought, overbullish, rising yields syndrome. I do recognize that my credibility in sounding a cautious note would presently be stronger if I had ignored further credit risks and captured some of the past year’s gains. But the awful outcome of this same set of conditions, which we also observed in 2007, should provide enough credibility.

Hussman proceeds to offer a detailed statistical analysis of how valuation and market action impact risks and returns. Curious parties are encouraged to read his essay in its entirety.

Here is how he rather bluntly sums up the current environment:

As of last week, the Market Climate in stocks remained characterized by an overvalued, overbought, overbullish, rising-yields syndrome that has historically produced periods of marginal new highs, slight declines, and yet further marginal highs, followed somewhat unpredictably by nearly vertical drops. I’ve often accompanied the description of this syndrome with the word “excruciating,” because the apparent resiliency of the market and the celebration of each fresh high, can make it difficult to maintain a defensive stance. Interestingly, the analysts at Nautilus Capital recently noted that the most closely correlated periods in market history to this one were the advances of 1929 and 2007. While exact replication of those advances would allow for a couple more weeks of further strength, we’ve generally found it dangerous to expect history to do more than rhyme. These hostile syndromes have a tendency to erase weeks of upside progress in a few days.

I have to agree with this assessment as well as that of Robert Prechter that this spring offers perhaps the greatest short-selling opportunity in history.

Fabrice Tourre, Scapegoat

Today’s civil fraud charges against Goldman were a surprise, but the devil is in the details, and the case against the firm doesn’t look particularly strong. Goldman claims to have actually lost $90M by investing in the ABACUS CDO (Bloomberg), and lead investor (and major loser) ACA actually had ultimate authority over the securities selected and knew of short-seller Paulson & Co’s involvement in the selection process (though not that they were shorting) as pointed out in an excellect article by Henry Blodget :

In reality, however, to make this case, ACA is going to have to make the embarrassing admission that knowing what Paulson & Co was going to do affected its judgment with respect to the transaction.  This information should NOT have affected ACA’s security selection process.  It should also not have affected ACA’s decision to go forward with the deal.  ACA is an independent firm staffed with experienced professionals paid millions of dollars to evaluate securities by themselves. What Paulson was or wasn’t planning to do, therefore, should have been irrelevant.

We also know that Goldman knew in advance about the SEC’s plans, and that the man picked out for a public stoning, Fabrice Tourre, is a Frenchman who was only 27 or 28 at the time of the misdeeds in question. The CDO business was the cash cow of the bubble years and a prime focus from the executive suite on down. Was this kid really that important in the scheme of things?

Tourre admitted in emails that he didn’t even understand CDOs very well. It is just a joke that this is the best scapegoat that they could come up with. Did Goldman bring civil charges against itself on a weak and obscure point via minions (like Adam Storch) at SEC in order to create a safe outlet for the mounting public outrage? It certainly looks that way from here.

Wake me up when a Goldman employee or alumnus over 40 with a net worth over $100m goes to jail.

Extreme optimism and extremely low dividend yields

The 20-day average equity put:call ratio has dived to new lows, and yesterday the single-day reading printed 0.32, among the eight lowest readings since 2004.

Indexindicators.com

From stockcharts.com, here’s the raw data going back to 2004, plotted against SPX:

It looks like the closest previous instance of such a string of super-low readings (though not as many as at present) was Dec 2003 – Jan 2004, which marked the middle of the final lunge before an eight-month correction of the bull trend. Of course, that was during the fastest period of mortgage and consumer debt accumulation the US has ever seen, whereas today we are still unwinding that mess.

The markets certainly think this is 2004 and that earnings are going to explode back to the peak levels of 2007, even though it took an orgy of debt to generate those for just a few short quarters. Dividend-wise, stocks are yielding half as much as the 10-year bond, which is guaranteed to deliver those coupons, while common shareholders just hold a derivative claim.

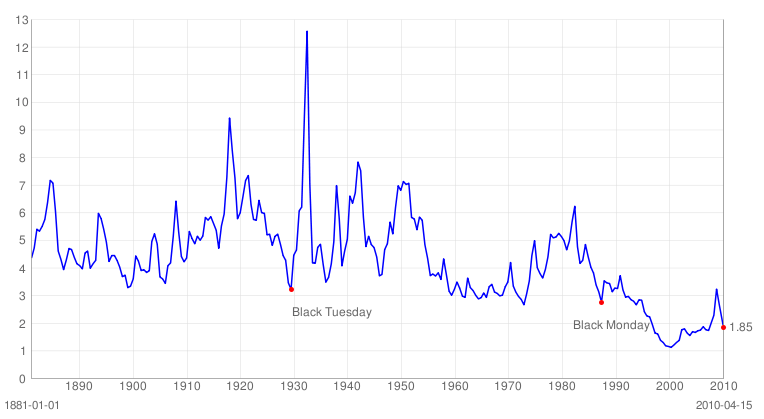
From multpl.com, here’s the dividend yield on the SPX (and theoretical predecessor) going back to 1881 (top) vs the inflation-adjusted price (bottom). Even at the lows last year, stocks were never even close to a good deal in historical terms, and in fact their yield then was about the same as at the 1898, 1907, 1929, 1966, 1968 and 1987 market peaks:

-

It’s clear from these charts that investing in a low-yielding market is not a winning strategy for capital preservation.

All-in, all over again

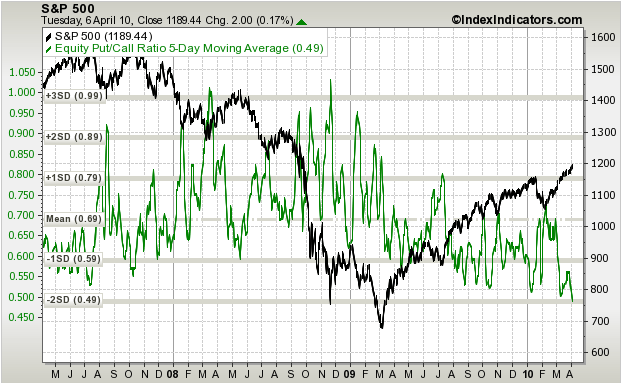
Ok, the 5-day trailing average put:call ratio is giving another screaming sell signal (the one in early March was the first in ages to not result in any decline, just a 2-week consolidation). History shows that ignoring these signals is extremely perilous.

Indexindicators.com

-

The 20-day average must be at an all-time low, though I don’t have the long-term data available:

-

There is no longer any question that today’s market conditions resemble those seen at major bull market tops. Traders, analysts and the general public are extremely optimistic about the prospects for the stock market, but with a yield of under 2% and a macro environment that is still working off the hangover from a debt binge, the likelihood of a sustained advance is very low.

I continue to hear that the market is being propped up artificially by the Plunge Protection Team or Goldman or JPM or some such combination, and while I think it is likely that parties like these do try to manipulate its direction, I doubt very much that they can have any meaningful impact. The markets are global and an expression of social forces too large and wild to control.

Central banks publicly try time and again to manipulate floating currencies, and their efforts are always futile beyond little blips (just ask the BOJ, which once threw away $30 billion trying to supress the Yen, to no effect). Besides, history shows that markets have always been irrational, since long before the PPT. The very fact that so many people blame the PPT for the market’s rise goes to show that there have been lots of bears out there, and markets don’t peak until almost all of the bears have faded away.

Market overvalued even if you accept very optimistic forecasts.

These charts and analysis come from Bill Hester at Hussman Funds. Hester and John Hussman do the best fundamental analysis of anyone I follow. It was Hussman’s writing, more than anything else, that first convinced me of the bear case back in 2006.

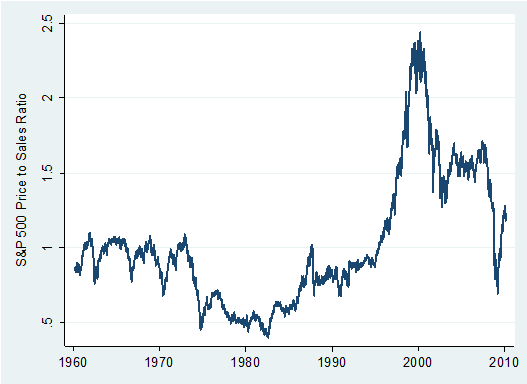
Except in relation to bubble valuations between 1997 and 2007 (which have produced flat or negative market returns), the market’s valuation looks overpriced based on widely-tracked fundamentals. Whether you look at price-to-normalized earnings, price-to-dividend multiples, price-to-book values, or price-to-sales multiples, they all sit above their long-term averages. The graph below shows the price to sales ratio for the S&P 500 since the early 1960′s. The current price-to-sales ratio of 1.28 percent is far above its long-term average (outside of the bubble valuations of 1997-2007) of about .83. Prior to the late 1990′s, major market peaks such as 1972 and 1987 were typically marked by a price/sales multiple not much above 1.0.

-

Since traditional measures of valuation are broadly overvalued, analysts who are recommending additional equity exposure tend to use P/E ratios based on future estimates for operating earnings. On that measure stocks are still overvalued, but less so. But the current forward operating earnings may be overly optimistic once you back out the assumptions they rely on. More modest assumptions would suggest that the market is overvalued even on forecasted fundamentals.

Analysts forecast that the S&P 500 companies will $78 by the end of this year, $93 through next year, and $106 through 2012, based on analyst estimates tracked by Bloomberg. That’s an expected jump of 25 percent this year, 20 percent next year, and another 14 percent the following year. Clearly, stock analysts aren’t buying the New Normal…

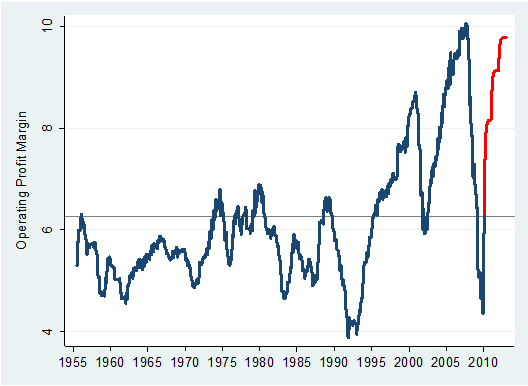
the aggressive expectations in forecasted earnings growth rates rest not only in corporate performance detaching from the economic climate, but also from corporate fundamentals veering far from their long-term typical performance. The clearest example of this is in the expectations for profit margins.

While earnings growth expectations are steep, sales growth expectations are more modest. Sales-per-share for S&P 500 companies is expected to grow about 5.5 percent this year and about 7 percent next year, according to forecasts. The difference between the growth rates of the top and bottom lines is implies a forecast for sharply rising operating profit margins. The graph below is updated from an earlier piece, and includes forecasts through the end of 2012. It plots the long-term level of S&P operating margins in blue. In red, I’ve plotted the operating margins currently being forecasted by analysts based on their projections for sales and earnings. Last October, analysts were about half way to pricing in profit margins that matched the record levels of 2007. Now, they are just about there.

-

These forecasted operating margins are important to investors who rely on using a P/E multiple based on forward earnings. Even with these forecasts for near-record profit margins, valuations on forward operating earnings are not favorable. The current multiple is about 14.8. As John Hussman has noted , the long-term average P/E ratio based on forward operating earnings is about 12. Taking the 14.8 multiple at face value implicitly assumes that the near-record profit margins assumed by analysts are now the long-term norm. Even a minor lowering of expected profit margins would cause the scale of the overvaluation to widen materially. Considering the aggressive expectations for profit margins, the market’s valuation based on expected results may be as stretched as it is on trailing fundamentals.

I recommend reading Mr. Hester’s analysis in full here, as well as John Hussman’s weekly market comments.