Don’t count on a big rally in commodities.

Yes, the “inflation/risk trade” is moderately oversold, but when oil, copper and the like start to fall, they can just slide straight down for months. I believe that the commodity rally of the past 15 months was just a dead cat bounce correcting the crash after the massive 2007-2008 bubble.

Now that we’ve had that correction (and then some when it comes to the metals), there is little reason for prices to remain elevated. The supply/demand situation today certainly doesn’t justify $3.00 copper or $1.00 nickel or zinc, and demand will be even weaker in a year when the construction bubbles in China, Australia and Canada are over.

Here’s a pattern I see in crude. Now that the uptrend (higher highs, higher lows) is busted (we made a lower low), all rallies may be short and weak:

TD Ameritrade

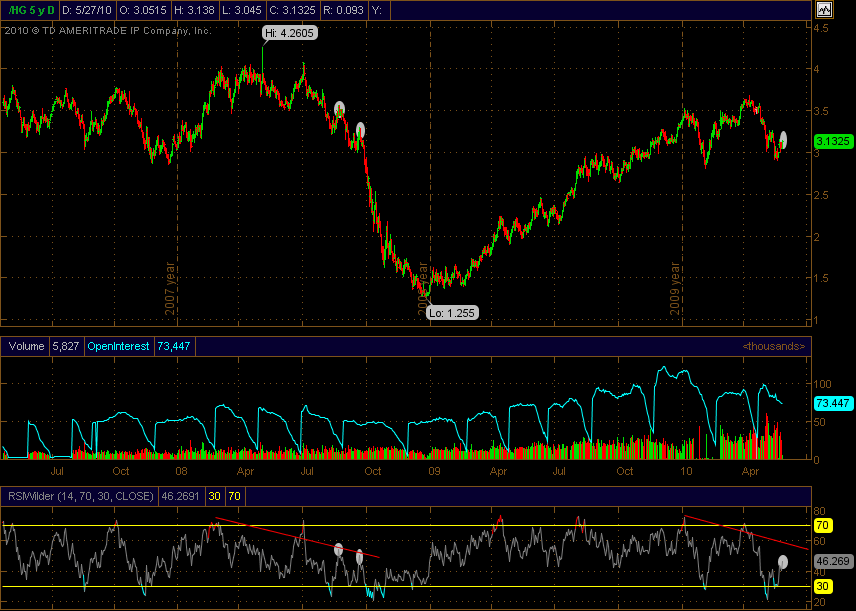
Copper’s uptrend is still technically intact but very weak(see RSI), and it could play out the same way:

-

Of course, if a large rally does develop, it will just be more fodder for the bears. I’ve entered a short on copper at $3.13 today, and am prepared to add to the position. I’ve also just picked up some July puts on crude futures (expiry June 17). I don’t like near-term options, but these got cheap today and will pay off 25:1 if oil is $55 three weeks from now.

If another broad-based rally in risk assets develops, I’m covered with longs on stock futures. However, I would not be surprised to see stocks (and the Euro) rally for a while here while commodities decline. When trends start to exhaust correlations can break apart.

Prechter interview: Fed may be ended within his lifetime.

From Yahoo! Tech Ticker last week. Lots of market talk, then Prechter makes the case for truly free banking, in which banks could decide for themselves what to use as money. He beleives that most banks and savers would chose gold, as they have for most of human history. The first segment below is mostly on the markets — the comments on the Fed are in the second:

EDIT: Sorry, I didn’t realize that there are actually two segments to this interview. The comments on the Fed are in the second half:

At the end, Prechter makes a key point about the gold standard: it is not a free-market solution, because it is a “standard” set by the government. Essentially, a gold standard is redeemable paper money, but as we saw in the early years of the Federal Reserve (and actually in older times with many other central banks), the exchange rate between paper and specie is set by the government. Paper money remains legal tender and the primary unit of account, so citizens are forced to use it and the banking cartel can still inflate.

A much better solution is no standard at all. Under such systems, the unit of account was typically a weight of gold or silver. Hence the British pound sterling, which was exactly that (sterling is 92.5% pure silver). Under these systems, there were safe banks that earned money by simply storing metal and clearing payments. Interest was low, but inflation was lower or negative, since the growth of human productivity from improved infrastructure and technology meant that goods and services became more abundant over time, while the money supply grew only as fast as new gold was mined.

This is why the price level fell steadily during the 1870s in the US while the economy grew at its fastest pace in history, and why the price of a postage stamp in England remained the same for 100 years, even as the country grew rich. There were booms and busts and banks failed, but because even big ones were allowed to fail, bubbles remained contained and the busts freed up capital for productive uses.

Such periods will come again. This is not the end of civilization, just the end of a long credit inflation.

Do we have a bottom?

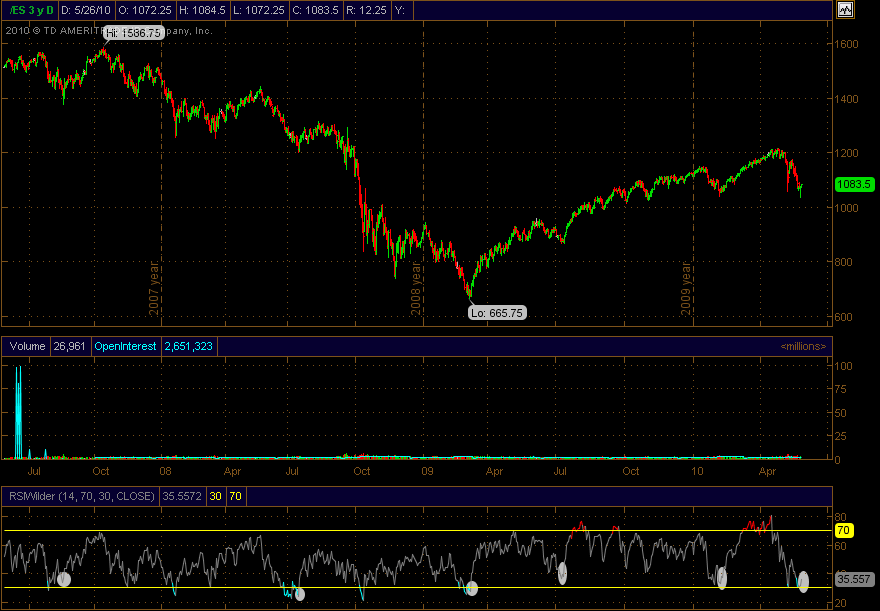
It would be nice and tidy if this morning’s 1036 print on ES turned out to be the low for a couple of weeks or even a month or two. Stock indexes made a price extreme unaccompanied by new highs in the VIX or yen or new lows in the euro, pound, copper, silver, gold and many bellweather stocks. The later rally was fast, furious and broad.

Here’s how this week in ES looks to me in the scheme of things. A right shoulder would be beautiful here:

TD Ameritrade

To re-iterate, I’m a huge bear for the 6-18 month horizon (my SPX target is an indecent number well under last year’s lows). I’m bullish for the 1-6 week horizon — I anticipate scaling back into a heavy short position in stocks, copper and oil on any rally here.

Carbs to make a comeback?

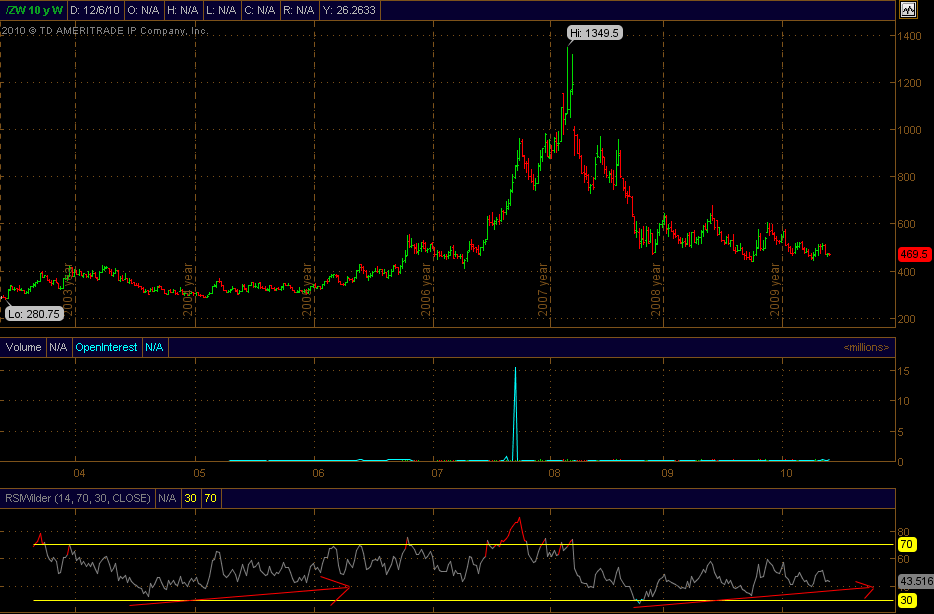
Trader sentiment on the grain complex (corn, wheat, rice and especially oats) has been very bearish for weeks, but prices have stabilized and RSI is turning up. This could be the set-up for decent rally, especially if general risk appetite comes back for a couple of weeks.

Here’s a chart of wheat going back to 2003, weekly scale:

TD Ameritrade

And here are oat futures:

-

You can see in these that the grain complex went through a mania in 2007 and early 2008 with the rest of the commodities, but that froth was quickly blown off in the crash. Prices are in rather neutral territory on a longer-term basis, which you can see for yourself by checking 25-year charts on indexmundi.com or futures.tradingcharts.com.

Swiss franc and euro look long-term weak, but extremely oversold.

Note the lack of divergence in RSI this time around, compared to late ’08 to early ’09 when CHF and EUR were preparing to rally (see my red arrows on the bottom of this chart).

This suggests that any rally that develops here (and I suspect that one will soon, since they are very oversold on several weeks of dismal trader sentiment) will not be as strong as what we saw in 2009, and that King Dollar is going to reign for a long time yet. Click the chart to enlarge:

TD Ameritrade

Bounce or crash, that’s the question.

Here’s the latest chart of the 5-day average equity put:call ratio. Option markets have done a lot to correct the historic extreme in complacency that we saw in April.

Indexindicators.com

Stocks are still only moderately oversold on a daily scale. RSI has made a sort of double dip into oversold territory, and MACD has also turned down to almost reach a downsloping support line formed by declines over the last 12 months. At some point this year all support should be smashed, but it would be rare to crash right from the very top. A relief rally would clear things up a lot and offer a great chance to get short.

Stockcharts.com

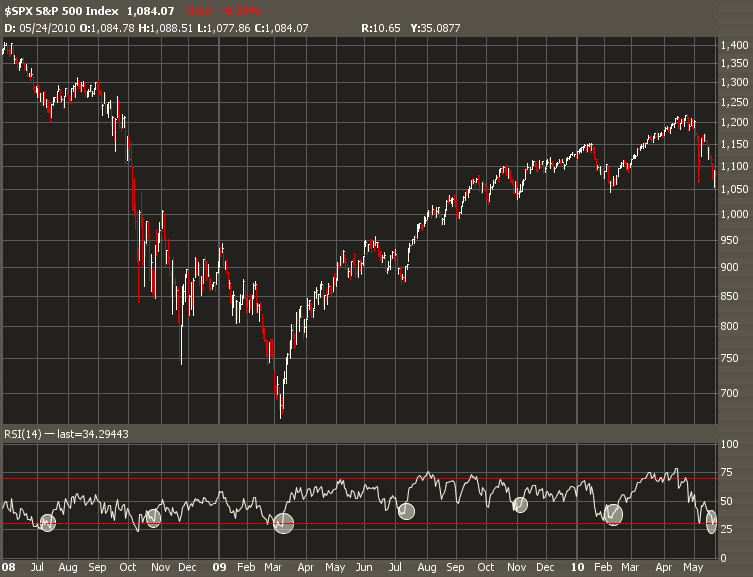
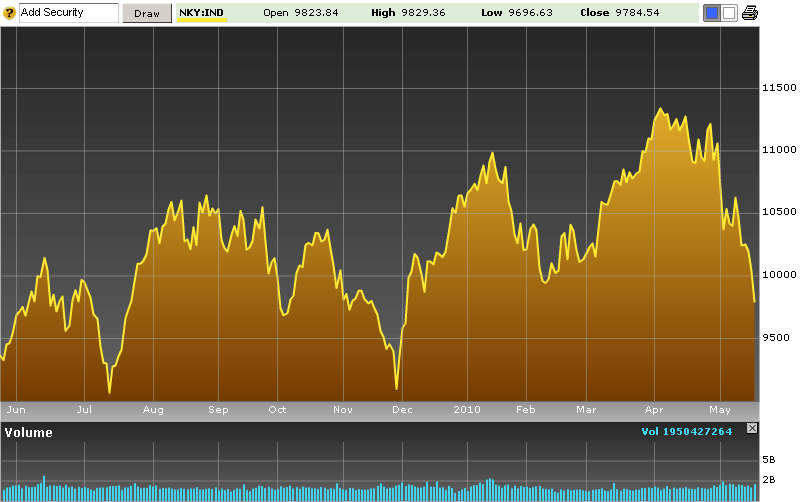
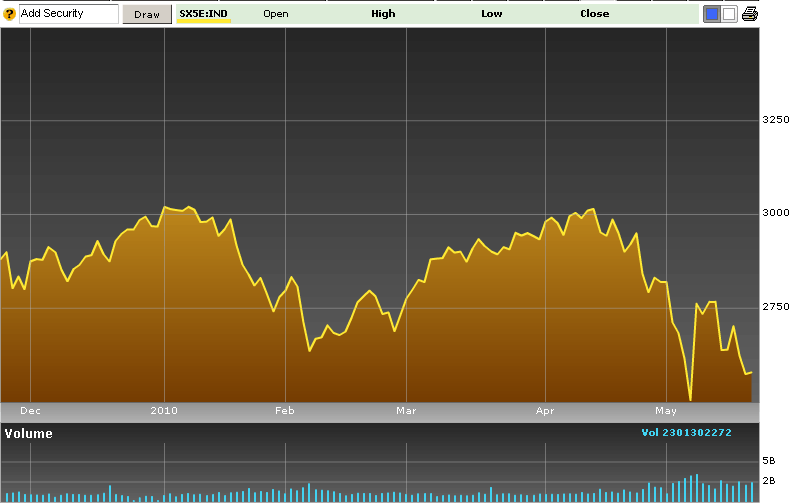
In contrast to the US markets, look at the extreme oversold condition in several major global stock indexes.

6-month Nikkei chart:

Bloomberg

The Eurostoxx 50 index:

Bloomberg

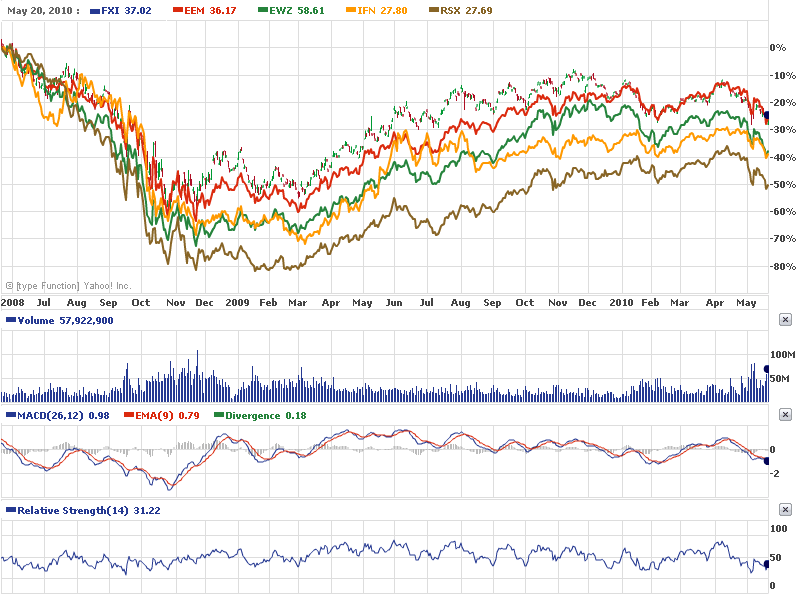
And here’s a 2-year view of a bunch of emerging markets ETFs. These I suppose could keep rolling over into a waterfall, but I’m not sure we’re at that stage yet.

Yahoo! Finance

Looking for a temporary bottom

World stock markets are oversold, and now that the US markets have taken a dip under the May 6 lows we have a stronger case for some near-term strength. The put:call ratio is also advising shorts not to press their luck, though there is still plenty of room on the upside, especially considering that this is indicator tends to oscillate from extreme lows to extreme highs:

Indexindicators.com

I’ve eased up on my short risk portfolio today by selling some puts, closing some ultralong ETF shorts, selling Yen and buying SPX and Nikkei futures. I’ll view any bounce as a shorting opportunity, since unlike most of the people on TV this week I don’t view this sell-off as a correction but the likely start of another leg down in a multi-year bear market.

I tend to be early on closing and easing up shorts, so take note that we don’t have much in the way of bullish action out there yet.

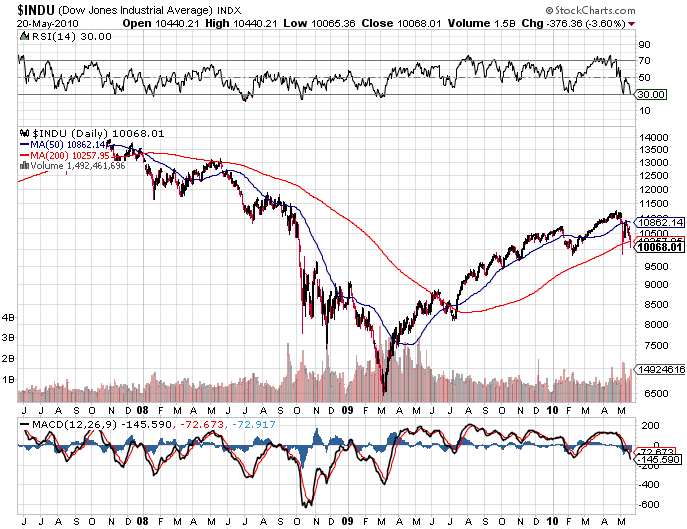
Not much between here and Dow 8500

Many of the world’s stock markets have already retraced large portions of the entire rally from the 2009 lows, but US equities have a long way to go before they give traders a scare. Judging from the sanguine attitudes expressed by various managers on Bloomberg TV, the majority remains firmly convinced that the lows are in and that any sell-off is just a healthy correction on the way to new all-time highs. This is exactly the same attitude expressed from late 2007 to mid-2008 before the crash got underway in force.

Stockcharts.com

Since we are still in the early phase of the credit deflation and most people remain unconvinced of its magnitude and implications, this next decline in asset prices could be very swift and deep, driven by the panic of recognition. Technical support has already been taken out, and dip buyers will be less eager, since they have seen that stocks can indeed crash. We could see an unrelenting slide like the two years from April 1930 to July 1932.

There won’t be another bounce of the magnitude we’ve just seen until real value is restored by attractive dividend yields. A 7% yield on today’s dividends would put the S&P 500 at 350 or the Dow under 4000, but this assumes dividends won’t be cut and that the recent years of extreme overvaluation won’t be matched by an era of extremely low valuations as the culture of financial speculation dies off.

Commodities crash underway: straight down or choppy?

Commodities did spectacularly well from winter 08-09 to winter 09-10. Many tripled in price, such as oil, copper and palladium. The world seemed convinced that another great phase of inflation was underway or would start real soon now.

The reality is that demand is anemic and that there has been little or no economic growth. The only exceptions are property bubbles in China, Australia and Canada that are just running on fumes, where America’s was circa 2006. The commodity bounce was purely a technical reaction from an extremely oversold condition, exacerbated by mistaken faith in Keynesian policies deployed worldwide. The rally began to stall out from mid-autumn to this March, and is now starting to roll over in force.

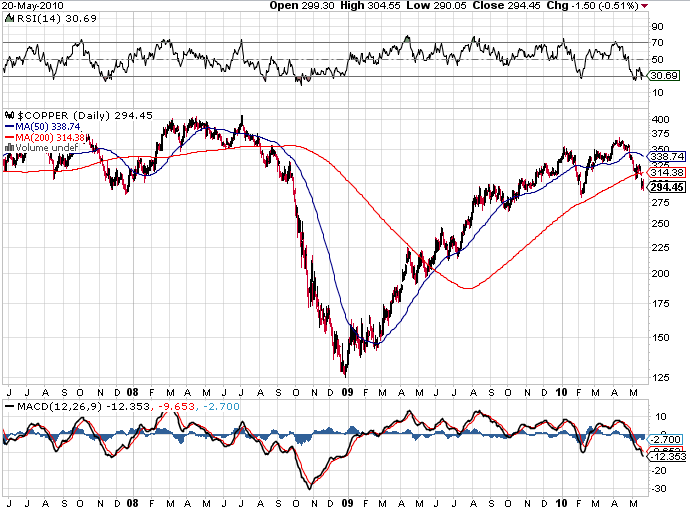
Here’s a 3-year chart of copper, a very liquid and widely followed market. Many believe it is an economic guage, but this is nonsense IMO, since it was trading well under a dollar as the economy was booming a decade ago, and like a lot of other commodities was very expensive in the stagnant 1970s (and right now of course). Prices are driven first and foremost by fads. Why else would you expect it to trade at $3.50 in the middle of a deflantionary depression when stockpiles are huge?
Stockcharts.com

I don’t like to brag, since I get plenty of timing wrong, but back in April I noted the divergence in RSI and MACD right as copper made its top around $3.60.

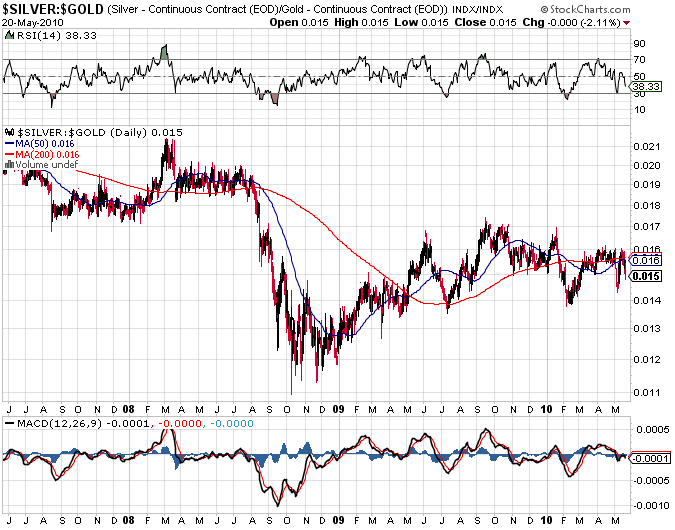
Another favorite guage of risk appetite is the silver:gold ratio, which has remained stalled for the better part of a year now, and looks set to decline again:
Stockcharts.com

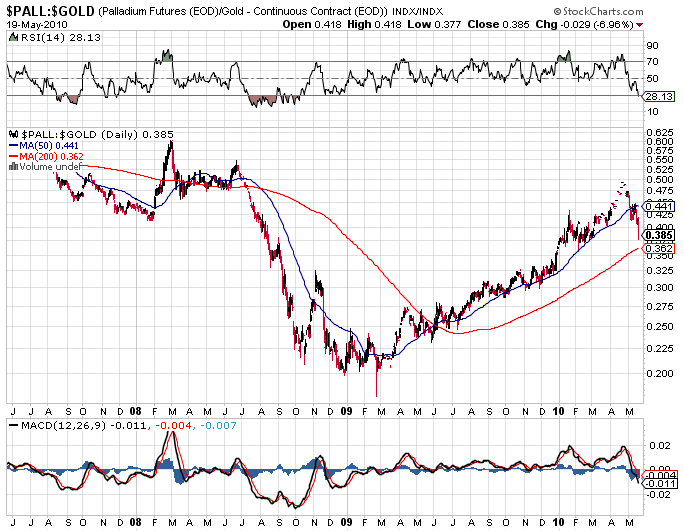
Also check out the palladium:gold ratio, since palladium experienced a major speculative bubble lately which has started to crash very hard:
-

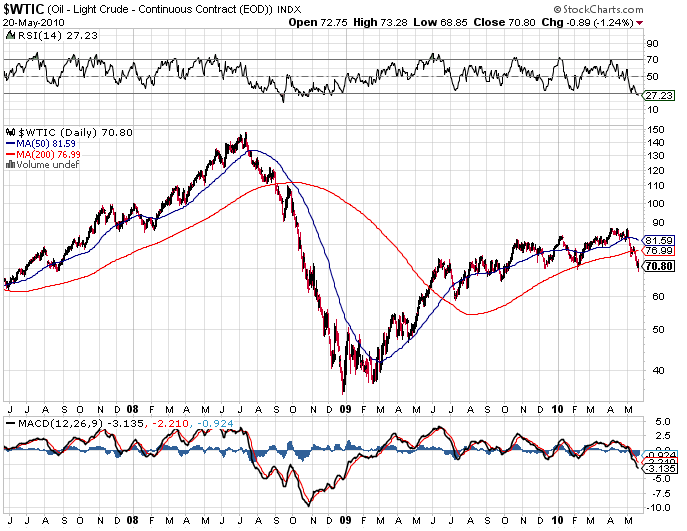
Here’s oil, West Texas Intermediate… in all of these commodity charts, note the severity and unrelenting nature of the last drop in 2008. There were few rallies where one could safely get on board for a short sale — you were either short from the top for the ride of your life or just had to watch.
-

I’m not expecting a lot of chop in these markets. I’d love a nice rally here to increase short positions, but it’s not the nature of commodities to take their time on the way down. Traders had months to see this trade coming and set up shorts, but for those who don’t over-leverage themselves it is by no means too late to get on board.

By the way, the commodity currencies (Australian, New Zealand, Canadian dollars, Brazilian Real and South African Rand) have also started to fall hard but have a long way to go to correct their rallies from last winter.

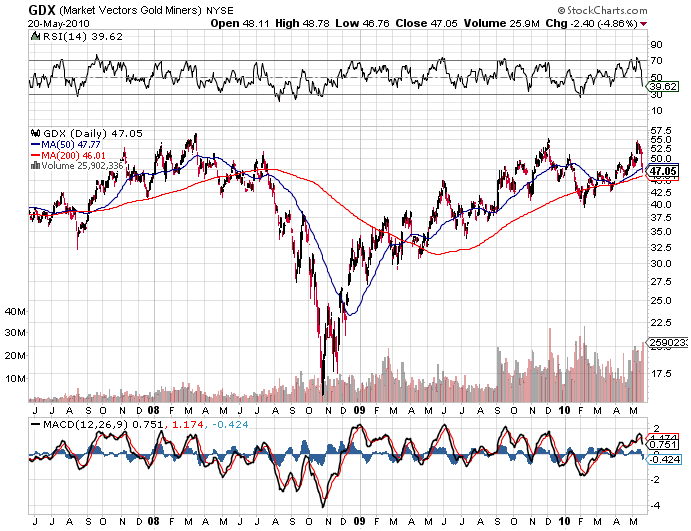
Want to see one commodity market that we’re definitely not too late to short? Gold and silver mining stocks (GDX ETF below). The gold bugs have been extremely confident and their ranks have swelled lately, so a deep set-back is much needed in this sector. After all, mining stocks often have a greater correlation with the S&P 500 than with the gold price (which I expect to fall, though not as much as stocks).
-

Ironically, I’m part of a group that’s building a huge database and stock screener in this space, called the Mining Almanac. Launching our beta site right at the top of a commodities bubble couldn’t be worse timing, so I’m trying to make lemonade and using it to search not for value stocks (what I designed it for) but the opposite so that I can short them!

For safety, don’t buy gold stocks, which are a financial asset with value contingent upon stock market conditions, tax laws (seen in Australia lately as their leftist government has slapped an extra tax on the mining industry) and myriad operational concerns. Along with plenty of cash and treasury notes, buy gold itself, either stored in your name in a vault oversees or in your personal posession. Gold is money, and in a deflationary depression with undertones of currency crisis, you want the very best.