Stock jitters, Gold and JPY still compressed

Gold and the yen each worked still lower this week on highly depressed sentiment readings. Each of these has had a negative relationship with the “risk trade” lately, falling as stocks have rebounded from their oversold and overbearish condition of mid-November. Now, stock sentiment has recovered to neutral territory, and traders are afraid of these sometime “safety trades.”

Trader opinion gold has been very low since late October, a full eight weeks ago. Every similar instance in the past several years has been followed by a substantial multi-week rally. That said, if the bull markets in precious metals and the yen are indeed over, we should expect downtrends to become more protracted, with sentiment remaining low for longer.

Here’s a 1-year daily chart of gold:

1-year daily JPYUSD:

I’m holding to a thesis that the risk trade is topping out here as the US slides into a recession that remains largely unrecognised. Tops are rarely sharp peaks, but consist of several months of choppy sideways action during which sentiment deteriorates from giddy to nervous and the VIX picks up even before prices have fallen substantially. I view the rebound since mid-November with that context, akin to the action of April-July 2011 or pretty much all of 2007.  Last nights mini flash crash in stock futures fits into that context of a increasingly jittery market.

We’re three months from the 4-year birthday of the (presumably) cyclical bull market. It is now older than most cyclical bulls within secular bears, though the last bull phase lasted from March 2003 to October 2007, 4.5 years.

Another cyclical bear and a recession and drop in corporate earnings may finally compress multiples to the investable levels required to build a solid base for another bear market. I don’t expect this to happen quickly, though, since prices have a long way to go before we see anything that can be called historically cheap. I wouldn’t be surprised to see stocks hold at or beneath current levels for the rest of this decade as inflation creeps in towards the end and boosts earnings, as happened during the latter stages of the last three secular bear markets (roughly the 1910s, ’30s, ’70s).

US already in recession? Hussman makes the case.

For those unfamiliar with John Hussman, I cannot offer high enough praise of this mutual fund manager for his prudent, long-term style of equity investing, and his actionable financial market and economic research. The man uses statistics better than anyone else I’m aware of in finance.

Lately, he has been making a strong case that the US entered recession in 2012, as shown by those indicators that, when viewed as a group, have a strong record of appearing at the start of recessions, and only at such times.

From his weekly market commentary:

While we continue to observe some noise and dispersion in various month-to-month economic reports, the growth courses of production, consumption, sales, income and new order activity remain relatively indistinguishable from what we observed at the start of the past two recessions. The chart below presents the Chicago Fed National Activity Index (3 month average), the CFNAI Diffusion Index (the percentage of respondents reporting improvement in conditions, less those reporting deterioration, plus half of those reporting unchanged conditions), and the year-over-year growth rates of new orders for capital goods excluding aircraft, real personal consumption, real retail and food service sales, and real personal income. All values are scaled in order to compare them on a single axis.


12.12. Fred recession data Hussman

Readers are strongly encouraged to read this week’s commentary in full and to browse Hussman’s archive here.

Intermediate-term set-up for a gold rally?

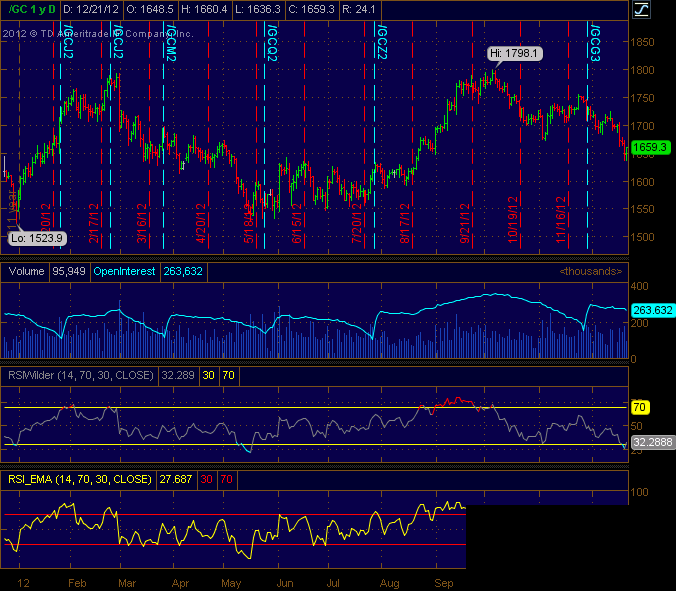
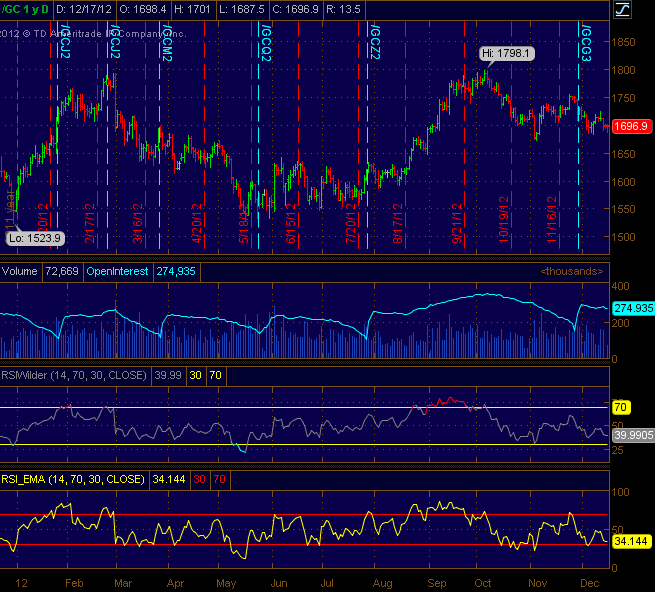
Traders have been bearish on gold and gold stocks since late October, the longest stretch in recent years. All such previous instances were followed by significant multi-week rallies. Here’s a daily chart, showing some divergence in RSI.

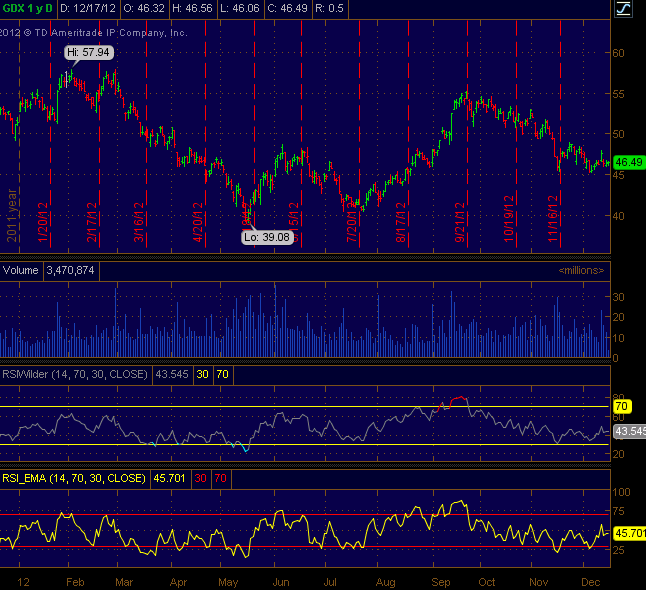
Here is GDX, the gold miner ETF, which looks good technically, as well as being cheap vs. the metal itself:


A caveat here is exemplified by the coffee futures market (see recent posts), which has steadily declined since a manic high 18 months ago. Gold and silver experienced a mania around the same time, which perhaps capped their 11+ year bull run. If that is the case, a situation like the present could actually resolve not in a rally, but in a crash, as crashes may develop from oversold and bearish conditions that would otherwise be bullish. For this reason, as well as the value discussion below, I would be careful about any longs and use a stop-loss.

I still maintain that gold is overvalued relative to a meaningful basket of other assets and metrics. Today, a kilo of gold buys (or rents) you more real estate, commodities, labor, automobile, etc. than at any time in modern history, save bottoms in those respective markets and tops in the metal.

This doesn’t mean that gold can’t rally for a few weeks or months or even make a new high – it just means that doing so would make it even more historically overvalued. The time of gold being a great value has long passed. It has done a very nice job at protecting holders against the Federal Reserve’s war on savings, just like it did a good job at protecting against inflation in the late 1970s, but gold peaked prior to inflation, and today gold may peak prior to the end of Bernanke’s tenure.

I often make the point that gold is not the only hard asset. In an inflationary episode, there are many ways to play. The dollar lost 2/3 of its value from 1980 to 2000, but over that period gold lost 90% of its value when adjusted for inflation (70% nominally). As in equity investing, the price you pay determines your return. I would look for hard assets that are closer to historical lows, or at least mean values, rather than something near a high.  Distressed real estate comes to mind, or even Japanese equities.

Heck, if we get another cyclical equity bear market within the post-2000 secular bear, there will be plenty of hard, productive assets available for reasonable prices in the stock market. BTW, every episode of double-digit inflation in the US since 1900 has ocurred during the latter years of a secular bear market in equities (1919-1920, early 1940s, 1979-1982). Thanks in large part to Mish‘s explanations of the credit market, I have been a deflationist since late 2007, despite the shrill warnings of the hyperinflation crowd. There is no telling how long our own Japanese situation lasts, but we likely have at least a couple more years to go.

Coffee update: new lows, traders still very bearish.

Positive divergence on RSI though. At this point, I would say the market can continue to make marginal new lows for a while, but that a significant rally may be imminent. This market has continued demonstrate how relentless a downtrend can be after a mania (mid-2010 to mid-2011). As often as not, such a market returns to the base from which the ramp started (around $1.30/lb in this case). 

Image


Japanese yen getting oversold on low sentiment.

Traders are again very bearish on the Japanese Yen, just as they were back in March 2012, prior to its 8% rally against the USD. JPY/USD is also getting very oversold, as shown by RSI on a weekly chart.

Image

The daily chart is showing a positive divergence in RSI, a bullish sign:

Image

However, a glance at the monthly chart shows a major break of the uptrend since 2007, as well as a deterioration in RSI (diverting downward over the last 18 months).

Image

Traders are more bearish now than in March, but this condition has not yet been sustained for long enough to give the buy signal we had then. Also, I believe the yen may putting in a long-term top, due to the trendline break as well as developing trend of lower lows and lower highs in sentiment readings. Any multi-week rally that may be setting up should be viewed in that context, perhaps as an opportunity for entering a short position.

That said, a yen rally would fit into the global context of a nascent US recession and top in equities, as the yen and dollar have been safe-haven trades along with government bonds from the US, Japan, Germany and UK, among others. Sentiment on US equities has rebounded sharply since mid-November, when it reached oversold territory by some measures. Equity sentiment is not elevated, but if we are entering a bear market it need not become elevated before deteriorating again (a trend of lower lows and lower highs in sentiment was observed in 2007-2008).

One other interesting piece of data here is that Nikkei sentiment has been on the low side since mid-2011. Sometimes the yen and Nikkei have a strong negative relationship, other times positive, so I don’t know how this fits into things, unless Japan is finally going to reflate after 20 years of a bear market in stocks and strong currency and bond markets. We may indeed be at such an inflection point. I would certainly rather buy and hold Japanese equities than bonds here.