We now have a syndrome that has rarely been followed by significant market gains, and almost always followed by a decline:
- Overvalued: Shiller PE above 18 (it’s 23)
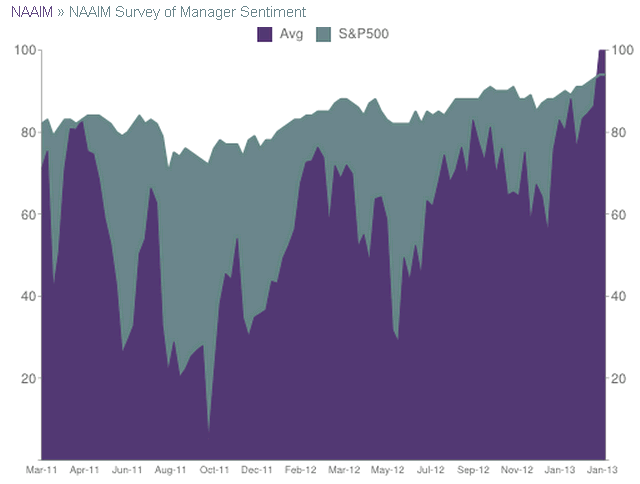
- Overbullish: High “bullishness” and low “bearishness” readings in DSI, NAAIM, Investors Intelligence, VIX, etc
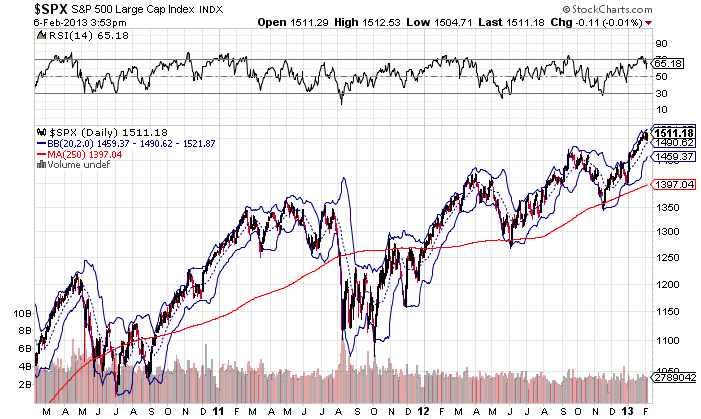
- Overbought: SPX near upper Bollinger bands (daily, weekly & monthly), over 50% above 4-year low, over 7% above 52-week running ave.
- Rising yields: Treasury bonds have recently declined, 10-year yields above level of 6 months ago.
- Developing choppiness: A smooth rise of less than 1% per day for several weeks, followed by several days of increased market volatility and sideways price action.
- Declining RSI: Indicates momentum is lost.
The first four of these points are the work of John Hussman* (though I may cite here different sentiment indicators or signs of an overbought market than he does). The last two are my own, and serve to identify a top with greater precision, as Hussman’s syndrome, while an excellent intermediate-term indicator, can be sustained for several weeks as the market continues to rise. When the last two are present, stocks rarely make further headway before declining, though they may churn sideways for weeks.
* Here is Hussman’s uber-bearish syndrome in his own words, with his own chart showing points in history when this has occurred:
- S&P 500 Index overvalued, with the Shiller P/E (S&P 500 divided by the 10-year average of inflation-adjusted earnings) greater than 18. The present multiple is actually 22.6.
- S&P 500 Index overbought, with the index more than 7% above its 52-week smoothing, at least 50% above its 4-year low, and within 3% of its upper Bollinger bands (2 standard deviations above the 20-period moving average) at daily, weekly, and monthly resolutions. Presently, the S&P 500 is either at or slightly through each of those bands.
- Investor sentiment overbullish (Investors Intelligence), with the 2-week average of advisory bulls greater than 52% and bearishness below 28%. The most recent weekly figures were 54.3% vs. 22.3%. The sentiment figures we use for 1929 are imputed using the extent and volatility of prior market movements, which explains a significant amount of variation in investor sentiment over time.
- Yields rising, with the 10-year Treasury yield higher than 6 months earlier.
The blue bars in the chart below identify historical points since 1970 corresponding to these conditions.