It’s quiet out there

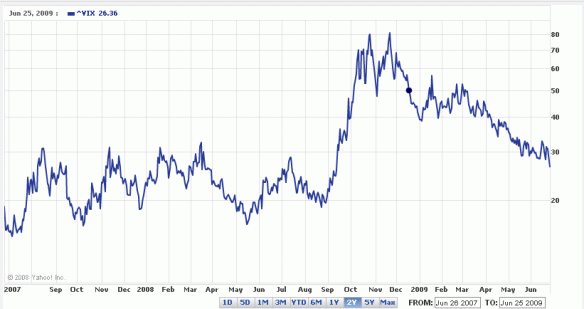
Where did the fear go?  While no one was looking, the VIX just made a new post-crash low:

-

If today’s market were a fishing trip, it would be 88 degrees at 11AM on a flat sea with no clouds and no signs of life. The only movement out there seems to be range-bound trading in currencies (the dollar is at the very bottom of its recent range) and a mild decline in oil. Times like these are good for establishing positions, whatever they may be. You can set tight stops or buy cheap options.

If the VIX gets much closer to 20, I’ll buy a lot more long-dated OTM puts. When this market rolls over, the revulsion is going to be horrific. This time it will be the death-knell of America’s equity culture, the dependence on stock appreciation for everything from exhorbitant college costs to retirement. The safety net is going to get ripped away, just like unemployment benefits for those laid off last year.

Americans still have barely changed their spending habits and long-term plans, but a year from now they will have, and plenty of them will be very upset about it. But never fear, our leaders know how to provide outlets for such emotions.

Key markets pushing resistance levels

US equities, the VIX, oil and copper are bucking against price levels associated with multiple peaks and troughs over the last month. The levels are as follows:

July copper: resistance at $2.32 – 2.35

August oil: resistance at $70 – 71 (BTW, I have been stopped out here and am on the sidelines)

NASDAQ futures (NQ): resistance at 1470-1480

S&P 500 futures (ES): resistance at 915 – 925

VIX: support at 27

These markets are looking short-term toppy, but a push through here would be bullish. Every time the VIX has dropped to 27 it has snapped back up, oscillating around the 30 level for the past 5 weeks. Today’s action should go a long way towards relieving the oversold condition (OTM put spreads, low TICK) that we observed earlier this week).

Divergent action today

It is noteable that bonds are holding onto very nice gains and even pushing higher today, that the dollar is well off its lows, and that precious metals are languishing. We have an unresolved market here. I believe that the bond market is generally the most prescient, so unless treasuries get on board and sell off hard, I’m holding onto most of my reflation-trade shorts with relatively tight stops (with the exception of the CHF short — yesterday’s crash on manipulation news provided a nice exit — I’ll reenter if we get a bounce, as with GBP).

Reflation trade stumbling

Trends reverse asset class by asset class. Here’s where the reflation trade stands about two weeks past its possible peak:

Gold and silver: Nice, clear tops and solid sell-offs. I’m pretty confident about those tops holding, since sentiment readings got so high there. Decent profits are in hand, and I am out of this market as of yesterday, since a corrective rally wouldn’t surprise me here. I am waiting to put on my shorts again.

Treasury bonds: Firm-looking bottom off very negative sentiment and a nice rally so far. There is room to go, though I have sold my calls and now just own TLT. Recent auctions have been very successful, as these nice yields are drawing the highest bid-to-cover ratios since 2007.

The dollar: Back within almost a percent of its recent low, but I’m not worried about a collapse because most people are already positioned for fresh lows. Today’s mini panic looks like a potential set-up for the bulls, and I am very long versus the pound, euro and franc.

Oil: Sentiment here never got extreme, but the chart looks toppy and this trade is not independent from general dollar/reflation fears. I am short futures with a tight stop, since today’s bounce took us right up underneath a clear resistance level. Fundamentally, oil is way overpriced for this environment. I still think $20 awaits at some point in the future.

Copper: Very similar to oil’s situation. No extremes, but toppy. I’m short with a tight stop. I expect $1.00 again at some point once the S&P drops under 600.

Pork: Ok, this has nothing to do with the rest of this market, but pork bellies and hogs have been nice winners for me lately. I believe there is a good chance that they just made a lasting low. The flu panic has never been anything but hot air — just another boogeyman to drive people to love big brother. When the fears fade, demand is going to outstrip supply. China bulls ought to be all over this: the Chinese love pork — they even have a “strategic pork reserve”.

Stocks: The markets were pretty oversold after yesterday, but today we worked off that condition, so anything can happen tomorrow. Everyone is watching the 880 level on the S&P, though it feels like after the 40% rally we could see more nasty 90% down days in the coming days or weeks, which would take us closer to 800 and give the bulls a real gut-check. 880 wouldn’t do that.

If we do get down under 850, things are going to get tricky: we’ll have to look at internals and sentiment to divine whether we’re due for a big recovery and re-test of the highs, or if we’re on the express train to new bear market lows.

It is also possible that we never get a deep sell-off, but just chop around within a 50-100 point range for a few more months while fundamentals deteriorate until Pangloss just can’t justify hitting the offer anymore. Chopping around the 900s without ever breaking clean through 1000 would be nearly as exhaustive for the bulls as this rally has been for the bears. It would draw them all in until none were left and volume dried up. That would be an awesome set-up for bears who aren’t themselves worn out in the chop.

This is why I’m such a fan of long-term puts for playing a bear market: with them you don’t have to worry much about how the market gets to its destination, so long as it arrives and on time. Right now, you can buy 36 months of leeway with December 2011 puts. I bought December 2008 puts in Q2 2006 and 2009s in 2007 — there was drawdown from rallies and time decay, but in the end it didn’t matter.

Robert Prechter interview

From this morning on Bloomberg. Prechter now has a perfect record since calling for a major crash at the 2007 top and then calling the interim bottom earlier this year. He was made for this environment. His 2002 book, Conquer the Crash, is a practically a blueprint for what is happening.

Takeaways:

Betty Liu actually extended some respect to a bear. Maybe she’s been hanging out with Matt Miller.

Prechter expects a corrective sell-off within this corrective rally, prior to new highs, followed by 2008 redux starting later this year or in 2010.

Final bottom: 2011

Deflation to “definitely” continue beyond another year and a half or so.

The crash is a good thing if you hold cash and buy at the bottom.

Credit was shoved down American’s throats for decades by government-created programs: FHA, Fannie, Freddie, etc.

PS – Bloomberg now has a youtube channel, and is pretty speedy about posting interviews. Now I have no need for a TV at all, which is good, since I’ll be without one all summer.

Here is an interview from February 25th, where Prechter called for covering shorts in anticipation of the biggest rally since the start of the bear market. He has time to go a bit more in-depth here:

And here he is at the very top of the market in 2007, 20 years to the day after the ’87 crash:

Michael Hudson interview

Got this from Zero Hedge, an excellent new blog.

Takeaways:

The debt must be written down.

Ancient Babylon had better economic models than our Nobel laureates.

Our politicians’ constituents are not the voters, but the bankers, who are parasites.

Obama’s economic team is the same crew that raped Russia in the ’90s and they will support an oligarchy in the US as well.

The reality of S&P 500 earnings

To say that stocks are anything other than dangerously overpriced with a P/E of over 130 and a yield of 2.5% on unsustainable dividends is either farcical or fraudulent.

-

For such a simple little metric, the P/E ratio is subjected to all kinds of perversions to deflate it to levels that can be passed off as reflecting value. At the very least, most bubbleheads try to make it less scary than its current level of 133 for the S&P 500.

Do-it-yourself P/E and dividend analysis

It is very easy to find out what the real index PE is at any given time. Just google S&P 500 earnings, and right at the top you will see a link to an Excel file on S&P’s website. Download it and see the data for yourself. The file provides 20 years of history on operating earnings, “as reported” (net) earnings, and cash dividends for the benchmark big-cap index.  Here is a permalink to the latest Excel file.

When talking P/E ratios, look at “as reported earnings,” which are the real bottom line, or as close as today’s accounting methods get to it. “Operating earnings” are all the rage these days with the sell-side and CNBC crowd, since they of course are higher, as they don’t include pesky items like depreciation, taxes and interest. Even more ridiculous is the use of “forward operating earnings,” which are not an accounting entry at all, but just what Wall Street analysts are telling the public that companies might report in future quarters and fiscal years.

To get the real P/E, the one that has been used as a gauge of value for decades, take the sum of the last four quarters of “as reported earnings”. Through Q1 09, for which 99% of companies have now reported, the index has earned a 12-month total of $6.87 (with the index at 915, the P/E is 133).

An S&P analyst has noted in the file that if Q3 comes in as expected, trailing 12-month earnings will be negative for the first time in history (I bet CNBC will decide to ignore that little factoid, since it’ll be a hard one to spin). Earnings are down from an all-time 12-month peak of $84.95 as of Q2 2007. To be fair to the bulls, the current figures include a loss of $23 in Q4 2008, when financial companies took their write-downs, though surely more of the same are on the way, and not just for banks.

Today’s earnings vs. recent history

Q1 2009 earnings were about $7.53, and Q2 and Q3 are expected (analysts tend not to be that far off for quarters directly ahead) to be more or less the same, so we are on pace for about $30 in annualized earnings. A glace at the historical data shows that this is about the same level as in 2001-2003, after a peak of $48-54 for a few quarters in 1999 and 2000. You have to go back to 1994-1995 to again see the $30 level, with the $20 level about the norm from 1988-1993. Assuming that the $30 is sustained, you could say that the current P/E is 30. That’s not value in anyone’s book.

Dividends from la-la land

One particularly striking fact in this data is that 12-month dividends have hardly budged from record levels, coming in at $27.25 as of Q1 2009. Dividends had been growing fairly moderately and steadily from 1988 to 2005, increasing from the $9 to $20 level over 17 years. At the height of the credit binge, companies were flush with cash to give away and buy back stock at inflated prices, rather than pay down the debt they took on to generate those temporary earnings. That they are continuing to pay these high dividends says to me that managers are in total denial or are playing charades to maintain the illusion of health.

The index only yields about 2.5% on current dividends, but if dividends fall back to just 2004 levels, the yield would fall under 2% if the index still trades at 900. Keep in mind that secular bear markets bottom by enticing with high cash yields, as investors by then are too pessimistic to expect much in the way of capital gains. At the 1930s and 1970s bottoms, the market yielded over 10% and 7%, respectively. Just a 5% yield on 2005-level earnings ($20) would be the 400 level on the index. A 7% yield on 1998 yields would mean the index trades under 250.

Whether you are a deflationist or inflationist, you have to admit that a strong dose of either would not be kind to equity valuations. In the ’70s, people demanded high current yields because future yields were so heavily discounted by inflation, and in the ’30s, stock valuations became extremely depressed as earnings tanked and investors panicked.

A crude indication of solid stock values is when the S&P 500 yields over 5% and the P/E is under 10. Stocks can get cheaper than that, but at those levels you really can buy for the long run. To say that stocks are anything other than dangerously overpriced with a P/E of over 130 and a yield of 2.5% on unsustainable dividends is either farcical or fraudulent.

Addendum:

For reference, here is a link to S&P500 earnings and dividend data going back to 1960.

Glancing at the typical ratio of earnings to dividends, if the index is earning $30, one should expect dividends to be about $10-20. There is no record here of another time when dividends were higher than earnings, as they are at present. This says to me that the sustainable yield today is not even 2.5%, but more like 1% to 1.5%, comparable to the peak of the peak dot-com bubble.

From this level of overvaluation in the face of declining fundamentals, stocks could fall hard for another 18 months to restore value fast (1929-1932 model), in which case the 200 level is likely by 2011.  Another outcome is to trade in a range for a decade or more and wait and hope for a bout of moderate inflation to increase the nominal bottom line (1968-1982 model). A third possibility is the Japanese model, where the S&P would get to 200, but over 20+ years. Long-time readers know that as a deflationist and Elliott waver I expect the first outcome, with the most stunning phase of the bear market soon to come.

Buy bonds!

It’s patriotic. No, seriously, I really like the 10-year note here. Today’s much talked about auction had the highest bid to cover ratio of any since mid-2007 according to Bloomberg, with plenty of interest from overseas investors. 4% is a pretty darned good yield considering that Case-Shiller CPI is running at negative 5%. 9% is a good yield in any security, let alone Treasuries in a depression.

Technically, I like this chart. Yields have now corrected the overshoot to the downside that we saw in December, but have not broken out so far that you could say the Treasury bull market is over:

-

I don’t know what inflation will be 10 years from now, or even the stability of the world’s fiat currency regime, but from a trading point of view, I suspect that dollar and inflation fears have run their course for this round. Traders seem to have forgotten that for the growing ranks of individuals who have lost their jobs but not their debt, or for businesses experiencing month after month of losses, cash is most definitely not trash.

As I said last Friday, I think we are at a turning point where various assets are peaking or bottoming more or less in synch. Gold, silver, the euro and pound may have printed their highs last week, while we are still waiting for oil and bonds to make a reversal. If all of these assets do actually turn, I would be highly surprised if the equities markets didn’t follow suit.

A toppy-looking week

Well, the reflation trade has managed to hold on for a few more days and even reached new heights, but the case for a pullback is looking that much better. Precious metals, non-dollar and non-yen currencies, oil and treasury yields have all benefited from what looks like a fairly extreme fear of inflation.

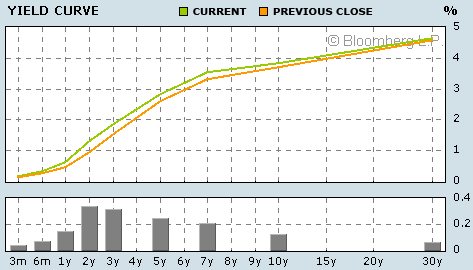
At 3.83%, the 10-year note, and certainly the 5-year at 2.83%, are even approaching levels at which they may be attractive buy-and-hold instruments. In a couple of years, we may look back at this sell-off as a great chance to lock in some respectable yields for a long bout of deflation. These bonds will at the very least vastly outperform the stock market or real estate.

I would be surprised if today’s sell-off in the mid-range of the yield curve doesn’t start to lure people back into longer maturity notes.

Source: Bloomberg.com

Today’s “gap and crap” in the stock market can also be taken as a sign of a top, which would coincide perfectly with a bottom in bonds and turnaround in the dollar. Euro and pound bullishness had been holding at well over 90% by early this week, as had that for precious metals. Silver’s two strong pullbacks from the $16 level were encouraging, as were the nosedives in the euro and pound.

From this juncture, I am still more enthusiastic about the prospects for the dollar, bonds and related commodity shorts than I am about stock market shorts, since the sentiment in the later has not reached the same levels of broad consensus. That said, it would be surprising if we don’t at least stop making new highs for a few weeks, if not fall well under 900 in the S&P.

Still a deflationist, huh?

Why am I so sure that we are stuck in deflation? Simple: the inflation we have experienced for the last 40+ years in the US and most of the world is less related to money printing, digital or otherwise, than credit issuance. This was a great credit bubble, during which families and corporations forgot all the lessons of irresponsible borrowing thanks to compromised central banks that provided cheap money and the promise of bailouts to the bankers who would otherwise be on the hook for extending worse and worse loans.

As credit got cheaper and easier to obtain, people relied more and more on it for everything from houses to cars to clothing purchases and even vacations. With easy credit, prices levitated across the economy until we reached the point where we could just not make debt any easier to get. After 105% loan-to-value, neg-am, teaser rate, no-doc loans, what else could be possibly be done to lure more people to borrow?

Debt is now a burden without a reward

Without the continued expansion of credit, there was no reason for prices to keep going up, but after 2005, without prices going up, there was no reason to borrow. Just like a light switch, in 2006-2007, debt became a burden without a reward, and ever since then the magic of leverage has been working in reverse to the tune of tens of trillions of dollars in lost equity.

Creating a few trillion dollars and simply giving it to banks with (still!) massively upside-down balance sheets does nothing to get the inflation ball rolling again. If the money were dropped from helicopters or spent into circulation by the government hiring tens of millions of people (as in the highly-socialist Weimar Republic, where the government owned factories) or, as is more likely here, in a truly massive war effort like the inflationary WW1 and WW2, we would soon have inflation. But nothing that we have seen so far is remotely capable of spurring inflation until asset prices and incomes have so collapsed that most of the bad debt (tens of trillions) is liquidated through bankruptcy.

Without the bailouts, we would already be most of the way through this recession, as in the short depression in the US after WW1, in which the government did very little except lower taxes. Assets like bank deposits and car factories would be finding their way into responsible hands, where they could be put to productive use. The surviving prudent banks would be lending to the surviving prudent manufacturers and prudent families, who would be acquiring assets from the foolish, who henceforth would be much less foolish. This natural process is exactly how the west achieved such fantastic real growth in incomes, technology and quality of life in the period from the 19th century to WW1.

At the rate we are going, prepare for many years of high unemployment (we’re at 16.4% now) and weak corporate earnings, as the prudent are taxed to prop up the foolish and cynical. This is not a formula for rising prices or a better standard of living. This is a formula for political, moral and economic decline.

This is not the kind of process that societies just can just stop on a dime. Nations can’t be expected to just have epiphanies, throw the bums out and install better governments. The baddies are so in control of the nation’s press, schools and political apparatus that events must run their course, over many generations, unto total collapse. Just ask the French of the 18th century or the Russians and Chinese of the mid-20th. The west has been on this course for nearly 100 years now, since a great civilization was dashed to pieces in the fields and forests of Europe and collectivism gained a foothold.

Three months to go?

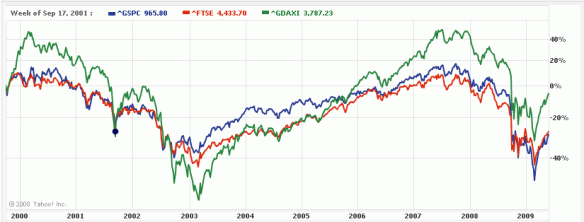
I prefer to do the most basic charting imaginable. I just look at history and try to find times that resemble the present. In tonight’s browsing of the record of mankind’s opinion of its future, my eye zeroed in on September 2001 to March 2002. The dot marks the week of September 17, 2001:

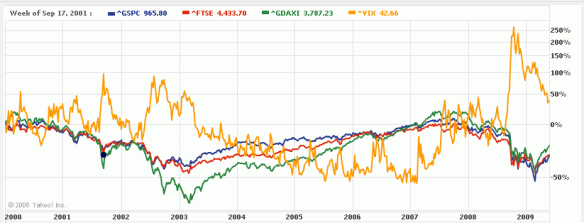
This interim bear market bottom came 18 months after the all-time peak. Sound familiar? We had a dramatic sell-off into that bottom followed by a very sharp recovery, no doubt boosted by desperate short-covering. The bounce had covered most of its total ground within three months, but it was not until the VIX retreated to levels last seen at the top of the previous bounce that the indexes registered their final highs. This occurred after another three months of choppy trading, after which the VIX snapped right back to panic levels and stocks began to roll over into the final descent of the three-year bear market.

If this is our fate, perhaps the S&P chops its way to 1050 by September and the VIX touches 20. In that scenario, a lot of pain awaits holders of puts and inverse ETFs, and a lot of gain awaits patient buyers of the same.

I don’t feel like posting 10 charts here, but I couldn’t help but notice how many major market turns have come in September and March. These are the equinox months, and I believe we are primed to experience a collective shift at these times as a remnant of our past as farmers and hunter/gatherers whose livelihoods were very much tied to the seasons. If anyone has the time and know-how, it would be interesting to see if the numbers back up this hunch.