Deflation trade returning?

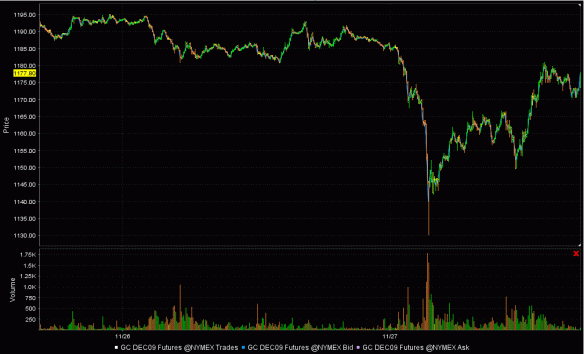
While Americans were on holiday, the last couple of days have seen some exciting market action. Stock indexes around the world declined roughly 3-8%, “safe” US and German government bonds rallied, and the dollar plunged to a new low then rebounded very strongly. Gold made a new all-time dollar high at $1196 as the dollar made its low, but when the buck turned yesterday gold plunged to $1130 as US stocks futures (which traded round-the-clock through the holiday) wiped out two weeks of gains in about 24 hours. Higher yield currencies such as the Aussie, Kiwi and South African Rand fell 3-4%, oil extended its decline to under $75, and copper got smacked $0.20 off its new high. One spot of green was natural gas, which extended its bounce to 14% off an area of strong technical support.

Gold showed us what can happen to a levered market after a parabolic move breaks its uptrend. In the wee hours today, it fell $55 in just two hours before rebounding right to resistance (the previous support at $1180, which when broken, precipitated the crash). Here’s a chart of the last two days:

-

Commentators blame the Dubai default for this week’s gut-check, and the event may have acted as a catalyst, but the fact is that the risk/reflation trade had reached new heights over the last couple of weeks on a wave of complacency. Early this week the VIX nearly hit the teens and the daily put:call ratio put in a super-low print, while the Nikkei, Treasuries and yen offered warnings that all was not well. Browsing through the world index charts on Bloomberg, it is striking how few other markets have followed the Dow to new highs this month. The troops have been losing heart since summer as the generals kept charging ahead, a classic case of inter-market non-confirmation, which can also be seen in the weak action in small-caps and sector indexes like the transports, financials and utilities.

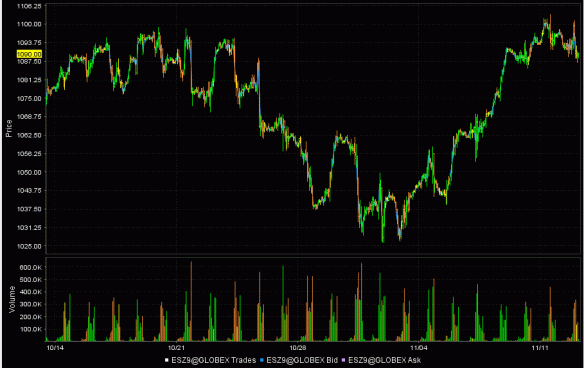
In last few trading hours of the week (this morning), many markets staged a very sharp recovery, as you can see here in this 1-month view of S&P futures:

Source: Interactive Brokers

Today’s pattern played out in nearly identical fashion in oil, gold, silver and other stock indexes. The stall point offered a clean spot for initiating or adding shorts, and those who did so were rewarded nicely in the last 30 minutes of trading as everything sold off quickly.

Next week should be very interesting. The risk trade plateaued for the last two weeks and went through the usual distributive action, so I have been expecting a down leg of some magnitude. Wouldn’t it be nice if this were the one to finally put a nail in the reflation coffin? I am sick of this market, as would be anyone who understands how far out of line these prices are with value or economic reality.

As Dubai’s default reminds us, this credit bust is far from over. There are still trillions and trillions in bad debt out there, and nearly every major bank in the world is still bankrupt and contracting lending (down another 3% in the US in Q3). We have all the hotels, condos and strip malls we’ll need for ages, and the consumer culture of the late 20th and early 21st century is just an unfortunate historical blip. Don’t tell that to Wall Street equity analysts, though — they still think the S&P will earn over $60 next year, just like in boom-time 2005.

PS — check out Dave Rosenberg’s latest essay for a good commentary on the week’s action. You have to sign up, but it’s free.  Click here.

The carry trade returns

Graphite here.

One development which has been making the rounds in the financial news lately is the development of a US dollar carry trade. I won’t ponder the details of the carry trade here, as I’m sure most readers are familiar with its mechanics. Shorting low-yielding assets like the dollar to fund purchases of higher-yielding ones — which is just about anything besides the dollar these days — doesn’t take a whole lot of work or talent or luck. All it really takes is a lot of that classic elixir of speculation, leverage.

Less interesting than the character traits of carry traders, though, is the spectacular and totally unforgiving fashion in which their speculations can come to grief. Throughout the bull market of the 2000s, AUD/JPY was the king of the carry trades. (Take a look, for example, at this Investopedia article touting the dazzling 83% gains from 2000 through 2007 in the pair.) With the Aussie dollar yielding nearly 600 basis points more than the Japanese yen, the cross pair was an absolute cash cow. As long as risk appetites remained robust, this trade proceeded in a virtuous cycle: its profitability attracted new JPY shorts, who drove the yen further down and made the trade still more profitable.

Then came the financial crisis, and suddenly the carry traders found themselves all leaning the wrong way in a very crowded trade, in a market with leverage as high as 200:1. The chart tells the tale:

Interactive Brokers

Source: Interactive Brokers

From July 2008 to January 2009, nearly the entire 2000-2008 bull move in AUD/JPY, from a low of 56 to a high around 104, was retraced. “Puking” doesn’t begin to capture the desperation with which longs exited this trade.

Earlier this year and a couple hundred S&P points ago, I had been somewhat dubious of EWI’s forecast for the next move down in equity markets to produce a VIX print higher than what was seen during the crash of October 2008. In the 1930-1932 period, the long, steady march down to the ultimate low never really matched the drama of the Great Crash.

However, the development of a dollar carry trade in risk assets shows that complacency and yield piggery, remarkably enough, still reign supreme in the minds of investors. The lessons of 2008 have been quickly unlearned, and its sickening drops in asset prices are now written off as temporary “liquidation events” unlikely to return for an encore performance, especially with the all-powerful U.S. Treasury and Federal Reserve backstopping everything with a wall of “free” cash.

If financial companies are truly protected by an unassailable wall of cash, why are they asking to borrow it from depositors at rates far above LIBOR? Here are just a few of the solicitations for cash I’ve noticed in the past few days:

Contrary to a common misconception of the Fed’s liquidity injections, money borrowed at 0% is not “free.” At some point, traders must liquidate their carry trade-financed assets to obtain the cash to repay the principal balance on that borrowing. In the meantime, those assets had better keep going up in price, or they find themselves in the position of upside-down and potentially distressed sellers. The instability of such trades, and their susceptibility to even the slightest downside shocks in prices, are obvious.

I doubt that anyone is buying stocks with 200:1 margin these days, but if carry trade dynamics are now driving global asset markets, this could presage an eventual explosion of volatility and liquidation of the sort usually only seen in the forex and futures markets.

Distribution time

Markets have rebounded feebly from their early November bottom, with speculative interest focused in fewer sectors than in earlier risk binges. The hot money is now concentrated in big-cap US stocks over small-caps, and in gold over silver, reflecting a shift in preference for quality over junk.

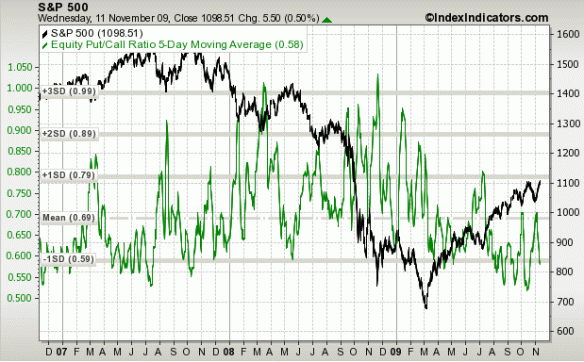
With upside momentum taking a breather, we’re in another distribution zone, where assets move from early buyers to late comers. The put:call ratio, my favorite indicator of complacency, has backed off its recent highs and could approach the extreme lows we’ve seen recently if stocks remain at these levels for a few more sessions. That would be another excellent short-entry signal.

Souce: indexindicators.com

Here’s the last month of trading in the December S&P 500 futures contract:

Source: Interactive Brokers

If precedent holds, we could chop around up here for another week or so and test the highs a couple more times before rolling over. What’s important is that we have made no net progress for three trading days, and that we have a clear stop for a short position.

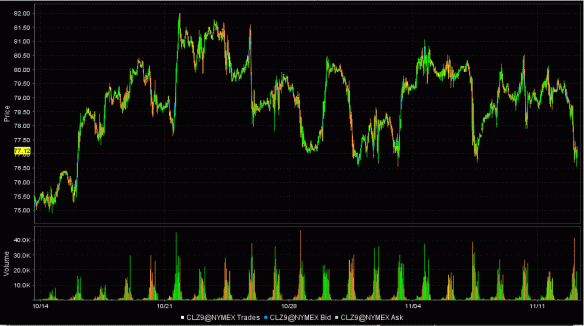
The moonshot in the Dow has not been confirmed by any other indexes, though a few of them have made minor new highs. The Russell 2000 remains the laggard, remaining well under the October and September highs. The Nikkei is similarly weak, and crude oil has just been working its way down a channel:

-

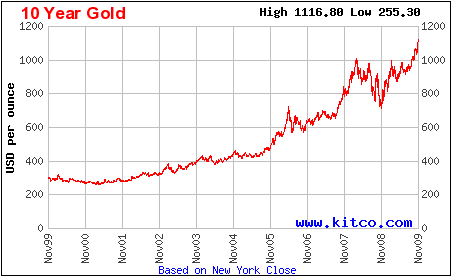
I also suspect that gold’s run is over or nearly so. I’ve never heard so much talk of gold on the financial news and in other contexts. 19 traders are bullish for every bear. This is about as lopsided as it gets, and we’ve had a huge parabolic rise. It is hard to nail down where these ramps will end, but like oil in 2008, when their momentum stalls, they can fall extremely fast.

-

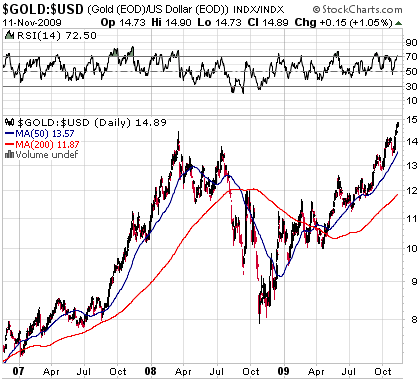
For another take on things, here’s the ratio of gold to the US dollar index:

-

Clearly the above trajectory is unsustainable. This is the kind of market action that draws everyone in and forces most shorts to cover. When that process is over, an asset can fall under its own weight. Conversely, the most fear and despised currency appears due for another bull run in 2010, in large part because of all the new debt that has piled up this year in the corporate bond frenzy and renewed carry-trade (borrow dollars and buy anything).

That said, gold should continue to outperform most every other asset class for years, since as professor Roy Jastram showed, its purchasing power increases in deflation when there is a gold-standard and when there is not (it is money, after all).

Trading notes

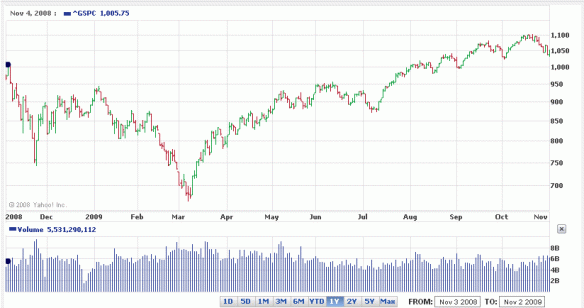
I thought I’d make a quick post here to update some of my thoughts on the markets. Here’s the S&P 500:

-

Most major world markets and US indexes look more or less like the above. Every one has rolled over since mid-October, and some made their highs several weeks before that. Based on measures of breadth and volume, this has been a strong and broad decline over the last two weeks. Fear has returned in pretty good measure, as witnessed by a 50% jump in the VIX and a breakout from its downward trend. Oil and precious metals fell, and the dollar broke its own downtrend, though it still needs another boost to confirm the move.

I was positioned very short equities, oil, metals and long the dollar, but over the last couple of days I’ve been tightening stops, closing positions and hedging the remainder. I believe we’ve seen the start of a major trend change, but for the next few days I would not be surprised by a minor stock rally. If one develops, I’d expect weak breadth and plenty of divergences if the primary uptrend has indeed been broken. That could be an excellent entry for short positions.

Tops are generally rounded affairs, though occassionaly declines from peaks will morph into waterfalls just when you’d expect them to ease up. We definitely have that potential here, and I will be expecting some fireworks on the other side of any little rally. It is entirely possible that the March lows could be revisited early in the new year, if a decline matches the aftermath of the 1930 and 1937 rallies.