Earthquake in Chile spooks the copper market

Reports indicate copper mines and ports are in good shape. The futures market seems to be overreacting.

Copper futures just opened an hour ago with a 6% pop from Friday’s close, up to just under $3.50 per pound. Traders are concerned about a supply pinch, since Chile produces 36% of the world’s copper. Bloomberg reports that four mines representing 16% of the country’s supply have been at least somewhat impaired:

Santiago-based Codelco, the world’s biggest copper producer, is restarting operations at its El Teniente mine after output was halted by the quake, which also closed its Andina mine. The two projects produce about 600,000 tons of copper. London-based Anglo American Plc said Feb. 28 power had been “partially restored” to its Los Bronces and El Soldado mines in Chile, which produce a combined 280,000 tons a year. The two mines stopped output on Feb. 27.

The mines were closed because of power outages, the two companies said. A rockfall also caused damage to a slurry duct at the Andina mine, Codelco said.

Codelco said the quake didn’t cause any significant damage to installations at El Teniente and it may open its Andina mine “in the coming hours.”

Power to the two Anglo American mines was “partially restored,” spokesman Pranill Ramchander said in e-mailed comments that didn’t give further details.

Ports Closed

Chile’s earthquake also severed the country’s main highway and destroyed bridges and apartment buildings.

The central Chilean ports of San Antonio and Valparaiso remain closed after the earthquake, TVN reported, without saying where it got the information.

Expanding copper inventories provide a cushion for supply disruptions, said Eugen Weinberg, an analyst at Commerzbank AG in Frankfurt.

“The exchange stocks worldwide are still very high and the market was in oversupply before the earthquake,” he said. Prices may still rise $200 a ton as traders switch focus from demand to “supply risks,” he said.

Also see this report from Reuters with much more detailed info on particular ports and mines.

It sounds like the miners have things under control and that the market is probably overreacting. This is Chile — they can handle earthquakes. The market isn’t going to be short of copper. It seems like we’re talking about 5% of world supply being down temporarily.

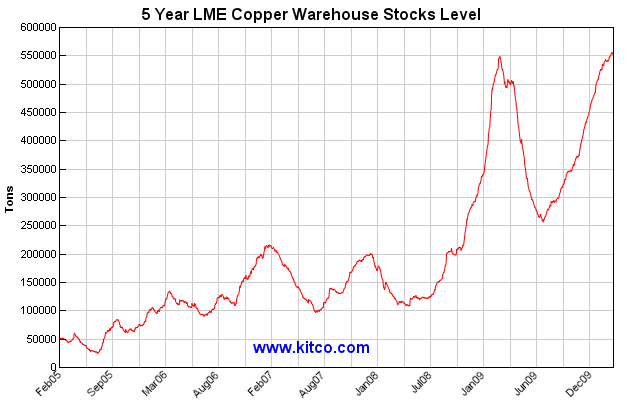
Demand is slack, and London warehouses are chocked full of the stuff (as are those in China), with the equivalent of almost a year’s worth of Codelco’s production:

-

Technically, the market looks weak, and a blip like this is probably not going to jump-start the bull unless the Chilean situation is much worse than it appears:

-

I view this as an opportunity, and I have taken a short position tonight.

(UPDATE): Codelco says it will meet its delivery contracts

1987

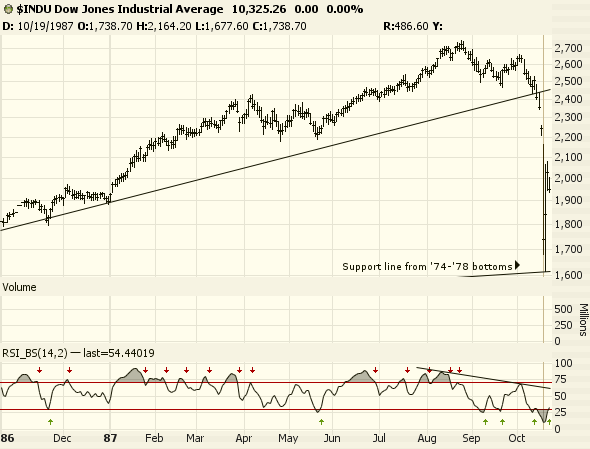
Since Graphite senses some parallels here, I thought I’d throw up a chart of the run-up to the crash of ’87:

prophet.net

I was just a kid, but I remember watching the news that evening. Upon hearing that the market had crashed 22% in a day, I thought to myself, “that doesn’t sound so bad – people still have most of what they had yesterday.”

Some thoughts on government debt during deflation

A question of Keynes vs. Kondratieff

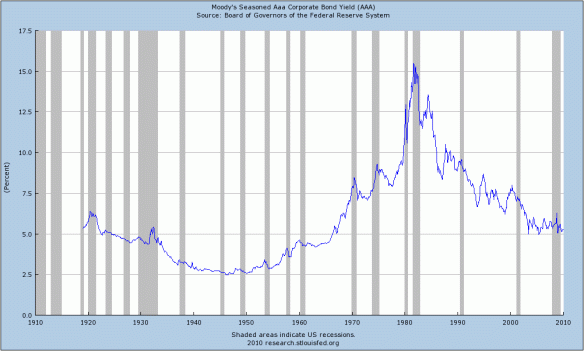
Until recently, the sovereign debt of nearly all governments would rally during panic episodes as stocks and commodities fell. This makes sense, as strong sovereign debt is cash for big boys, and investors are forced to reach further and further out for yield as short-rates are driven to zero or negative. However, starting with Greece, this pattern may change, as bonds are likely putting in a secular top in the 2008-2016 window. Their last bottom of course was the early 1980s, and their last top was 1946-47. The indebtedness and unabashed Keynesianism of all of the world’s governments seem to virtually guarantee higher interest rates in the coming years, even though US, German and Japanese bonds are still finding a bid during panics.

We have already seen the beginnings of this development in municipal bonds and the crappiest sovereign debt, but the market may slowly realize that it is all crap, beyond the short-term credit of the strongest governments.

Prechter makes the point in Conquer the Crash that higher rates on risky long-dated sovereign debt are part and parcel of deflation, an increased preference for the safest cash and cash alternatives. Steepening yield curves fit right into that trend. If the long bond sells off hard, this does not mean the end of the dollar, but the opposite. All else being equal, if T-bonds fell with stocks this year, it would just mean that the US government would finally feel the same pinch as everyone else.

Now for the tricky part. We have to keep in mind that interest rates are more than just a mechanical product of fiscal deficits, savings rates and politics. They are a kind of natural social phenomenon, a reflection of forces I can’t fully understand. They are not rational: why were short-term rates in the low single digits during the second world war when the US had just abandoned the gold standard, had a debt:GDP ratio of over 100% and inflation was running at 8-12%? Why were they still double-digit in the mid-1980s when the economy was good and inflation was 3-4%? (For some charts and discussion of the long-term rate cycle, see this post). The only answers that make any sense are that it was time for rates to bottom and then it was time for them to top.

We are certainly entering what *Kondratieff described as winter, when debts are called in and defaulted upon and cash is at a premium. This is associated with low interest rates, reflecting a low demand for credit, provided that the monetary unit retains value, which it tends to do since this unit is how debts are denominated and settled. And with deflation very much a reality, low rates can provide a high real yield so long as the credit is sound. With housing and wages falling by large percentages and every consumer good on sale, what is the real yield on a 10-year note priced at 3.6%?

There is no telling how long rates will stay low or how low they will go. See Japan, 1990-

Those are the market rates on the credit of a horribly indebted nation with terrible demographics that has been trying to spend its way out of recession for 20 years. Is there a better way to explain this than Kondratieff winter?

If social forces demand that governments start to shift towards frugality and default like the rest of society (and government is a reflection of social mood), this would be very supportive of the current fiat regimes. Think about it: what would happen to the Euro if Greece defaulted (which is what they should do)? Billions in euro-denominated balances would go “poof” and the remaining euros would be worth more.

What if younger generations of Americans, the ones who most enthusiastically support Ron Paul and even phonies like the new senator from Massachusetts, start to exert pressure for the rolling back of that $70+ trillion in retirement and health-care promises? Those are contracts that the government can’t honor, so by definition, it won’t. It will try to pretend otherwise, but it won’t. In effect, much of the debt will be repudiated.

There are huge caveats to the above, such as radical socialism or expanded warfare, but there are going to be real deflationary undertones to social mood that may effect policy and prolong the current paper regimes for longer than almost anyone suspects. Kondratieff winters are not short episodes, but generational, and if the last two turning points in the interest rate cycle are a guide, there could even be another ten years to the bottom.

That is hard to believe right now, but it is possible if social forces demand default. I can’t gauge the odds very well, but I have to consider this longer-term bull case for treasury bonds and a few strong currencies. Bottom line — history has not been kind to paper money and government bonds in times of crisis, but the nature of deflation may give them a longer life than we have assumed.

If you just can’t wait to short some sovereign debt, try Japan before America. They may be a generation ahead of the west in the rate cycle, and really, how much lower could they go?

*Kondratieff waves in the US (click image to expand):

welling@weeden, 1.23.09

One thing that strikes me in the above chart is how huge the latest wave is compared to the others. At 60 years and running, it is the longest, and prices, rates and stocks have gone up so much more than during any of the previous three. Just out of proportionality, it would be perfectly fitting if rates and prices fell for another 5-10 years.

Here’s a clearer view of the Aaa corporate bond rate from 1919 to 2010:
-

Also see Rothbard and then Mish on Kondratieff theory. As Rothbard makes clear, winter is not necessarily an awful time to be alive, judging from the strong economic growth of the 1830s-40s and 1880s-90s. This means that prolonged unemployment and war can’t be blamed merely on the credit cycle, but that fingers must be pointed at the socialists, Keynesians and fascists who’s actions directly brought about the nightmare of 1929-1945.

Bob Prechter: “Cover your shorts” (edited w/ new video)

He said that exactly 12 months ago yesterday:

k


-

Here he is again on November 23 last year, calling for another decline in 2010 at least as bad as 2008, as well as a bullish call on the dollar:

-

And here is a video from Yahoo just a few days ago. Crappy quality on this recording, but not unwatchable. He shows that mutual fund cash levels are at record lows, meaning managers are “all in.”
Also, individual investors have piled into municipal and corporate bonds, which are awfully risky at these prices.

Yen and bonds, two of a kind

I don’t know exactly what to make of this pattern, but it is not unusual to see these two move together. As forms of cash, they each tend to do well when the deflation trade is on. In fact, other than short positions, they are the only things that beat the dollar when everything else falls.

-

I don’t know what it means that the Yen has been doing so well even as stocks have risen over the last year. Perhaps it’s a vote of no-confidence.

Even if stocks and commodities roll over hard, I actually wouldn’t count on the Yen rallying as powerfully as of 2008, or even at all. Its long-term trend has been weakening.

Pre-open Dow futures

It would be very predictable if stocks just rolled back over and had a very bad day:

Interactive Brokers

The caveat of course is that yesterday was a powerful move up, hinting that there could be more to come. That’s what stops are for, and we’ve got plenty of clear ones here.

Strong bonds, strong Yen, weak commodities = little confidence in stock rally

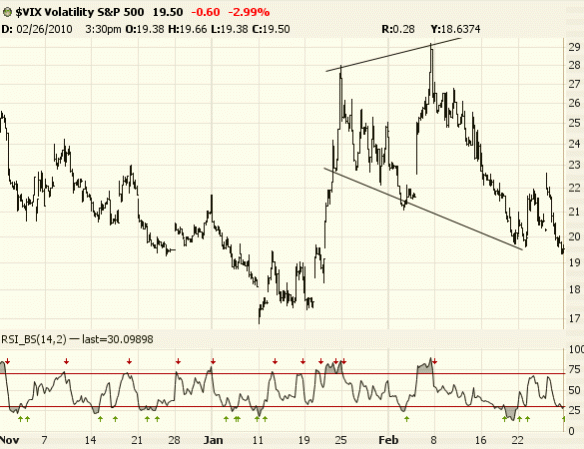
In stocks, this whole gap/ramp sequence is something we’ve seen at a lot of tops in the last six months. Just compare it to January:

Prophet.net

We’ll need a solid break of Monday’s high to suggest that we’re not going down here. No matter what happens, remember, this is not 2004. Try to remember what 2004 felt like. The credit machine was still humming away.  Today, the bubble is dead — this is just a giant bear market rally in a giant bear market.

Some more Dow history

Continuing the top series

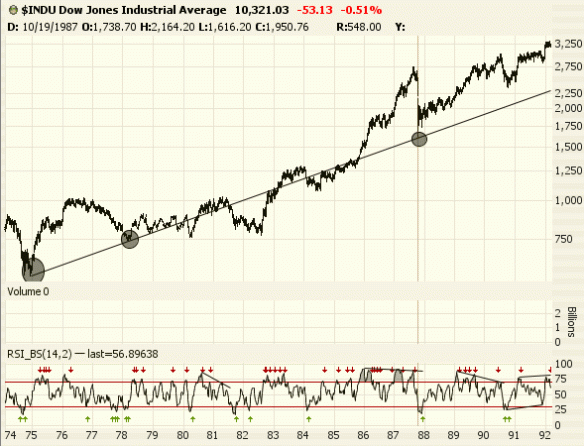
Be sure to look at the lines on these charts, including RSI trends. If you gave Paul Tudor Jones nothing but graph paper and a ruler and he would still be a star. With price and RSI, you have all you need technique-wise. The rest is all emotional.

Prophet.net

-

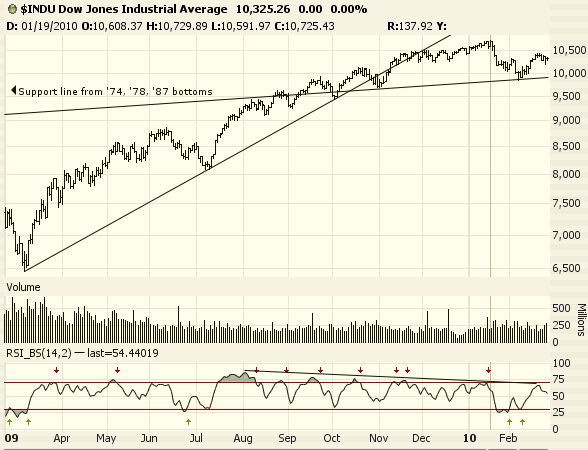
Here’s something I find interesting. A line connecting the bottom ticks in the 1974 and 1978 crashes precisely arrested the 1987 crash.

-

The crash of ’08 solidly busted it:

-

Skeptical that these old trendlines matter? Look at the support line connecting the depression lows of July 1932 (40) and May 1942 (92). It served as support an addional five times, and when it was finally breached in 1969 at 920 the market crashed that very week and entered a decade-long bear market.

-

One more oldie is still very much in play, the line connecting the secular bear market lows of 1932 and 1974. Today it runs today through roughly Dow 5600: