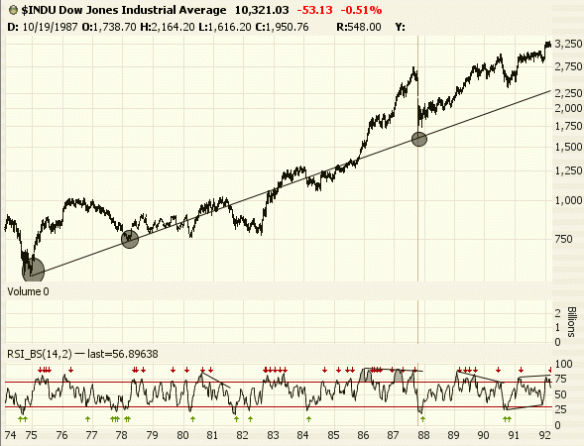
Continuing the top series…
Be sure to look at the lines on these charts, including RSI trends. If you gave Paul Tudor Jones nothing but graph paper and a ruler and he would still be a star. With price and RSI, you have all you need technique-wise. The rest is all emotional.
Prophet.net
-
Here’s something I find interesting. A line connecting the bottom ticks in the 1974 and 1978 crashes precisely arrested the 1987 crash.
-
The crash of ’08 solidly busted it:
-
Skeptical that these old trendlines matter? Look at the support line connecting the depression lows of July 1932 (40) and May 1942 (92). It served as support an addional five times, and when it was finally breached in 1969 at 920 the market crashed that very week and entered a decade-long bear market.
-
One more oldie is still very much in play, the line connecting the secular bear market lows of 1932 and 1974. Today it runs today through roughly Dow 5600:


