Here’s the latest chart of the 5-day average equity put:call ratio. Option markets have done a lot to correct the historic extreme in complacency that we saw in April.
Indexindicators.com
Stocks are still only moderately oversold on a daily scale. RSI has made a sort of double dip into oversold territory, and MACD has also turned down to almost reach a downsloping support line formed by declines over the last 12 months. At some point this year all support should be smashed, but it would be rare to crash right from the very top. A relief rally would clear things up a lot and offer a great chance to get short.
Stockcharts.com
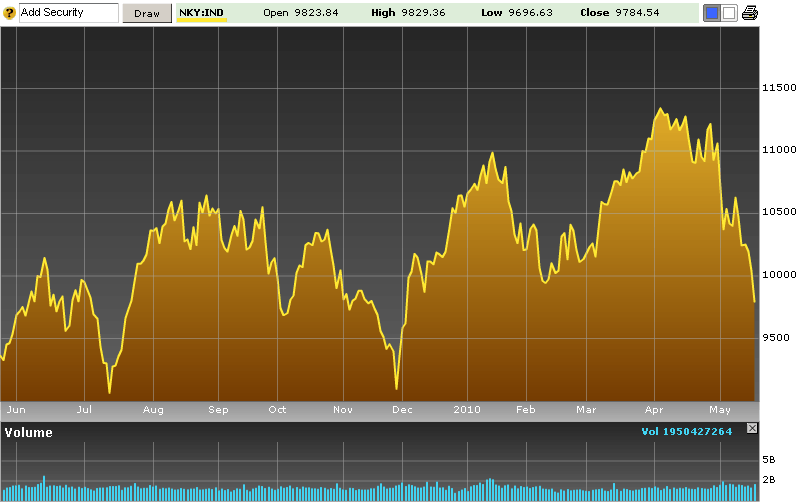
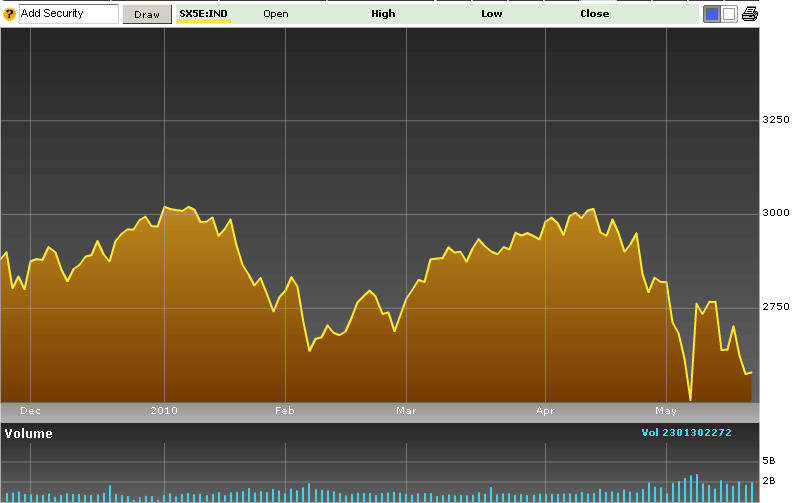
In contrast to the US markets, look at the extreme oversold condition in several major global stock indexes.
6-month Nikkei chart:
Bloomberg
The Eurostoxx 50 index:
Bloomberg
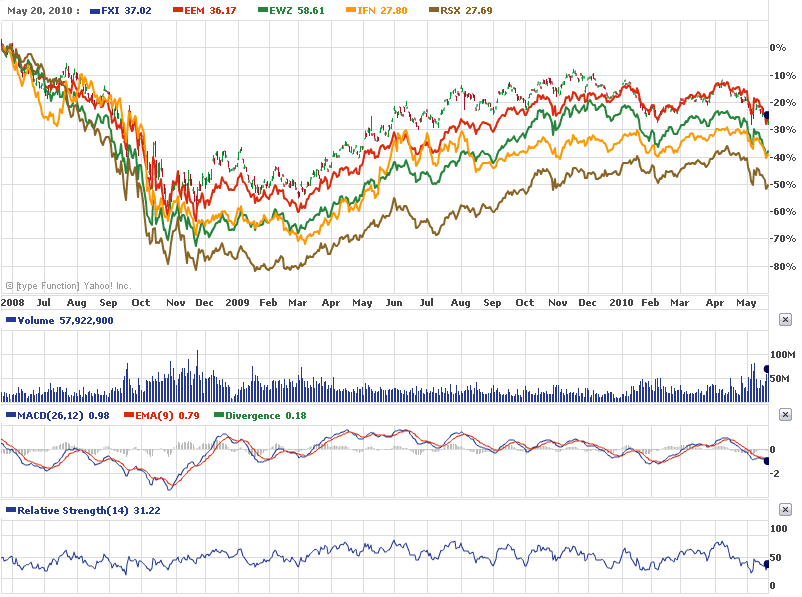
And here’s a 2-year view of a bunch of emerging markets ETFs. These I suppose could keep rolling over into a waterfall, but I’m not sure we’re at that stage yet.
Yahoo! Finance


I’ve read that most crashes occur when the market is over sold so there is a good possibility that we could roll over into a waterfall. But just like you I’d like to see a good bounce that will let me get in short.
That’s exactly right — crashes are rare, but when they happen it is often from conditions like these. But of course conditions like these lead to rallies much more often than crashes. It’s an interesting set of probabilities.