Today I’m going to lay out what I’m watching for clues about the intermediate-term prospects. The action of the last 4 weeks has been more suggestive of a reversal than any we’ve had since the March 2009 lows. However, even if a top is in hand and we are finally at our spring 1930 moment, I’m not willing to throw caution to the wind and discount the possibility of another few weeks of rally.
Let’s start with the 5-day average equity:put call ratio, which has nailed so many intermediate-term tops, not least of which this last, which it suggested would be followed by a serious decline:
Indexindicators.com
The put:call ratio could use a bit more of a reset, which could be achieved by just a few more days of calmer or rising markets. Nothing major required here, just a pause.
This break has shaken up a few traders, but judging from interviews this week, the majority remain fairly sanguine about a continued bull phase and consider this a healthy correction, much as they did the first declines off SPX 1550 in late 2007 and early 2008. Also, the past year has established a very clear pattern of modest declines followed by new highs on extreme bullishness. Traders and their machines may be programmed to buy this dip, but with the recent technical damage (we busted the last low for the first time in the whole rally and experienced a mini-crash) I’d expect any rally to be relatively shallow.
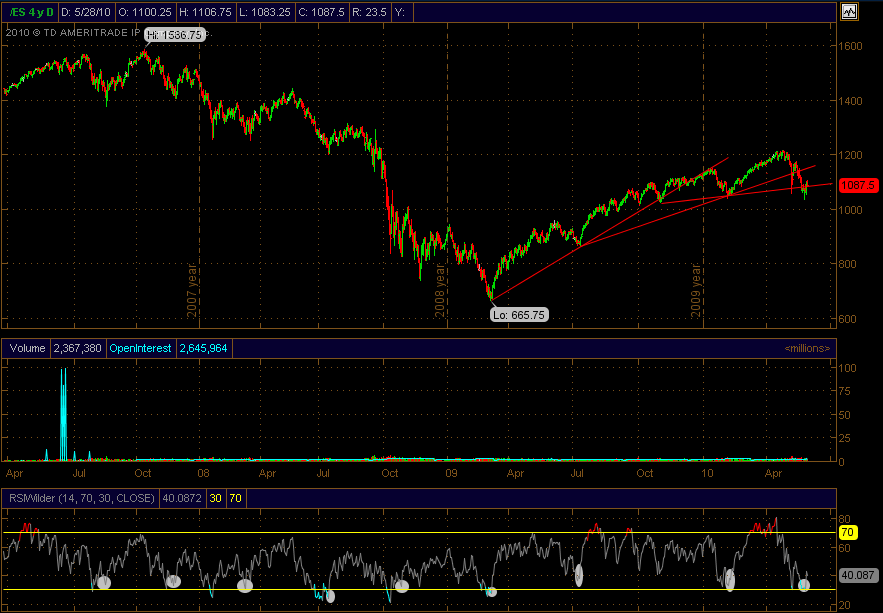
There is a pattern of reduced oomph on each subsequent rally phase, which you can see in the diminishing slopes of each rally. You can also see the weakening of the larger trend in the angles between subsequent lows. (Click to enlarge the image.)
TD Ameritrade
I’ve drawn those ovals on RSI to show a technique I have for picking bottoms. It gets most intermediate term bottoms, and perhaps more importantly, it has a low false-positive rate. A rally becomes likely when you get a double bottom in RSI. This works on any scale you chose, from 1-minute to daily or higher. The likelihood of a rally increases if the second bottom on RSI is higher than the first. This is common because the middle wave of a decline is usually more intense than the final wave.
Now, this current juncture has such a double bottom signal, though the second RSI bottom is not higher than the first. It is also trickier because the first was formed by the latest black Thursday, May 6. I’m not sure how such an event should factor in, but it throws off our analysis somewhat. Perhaps the May 6 event should be discounted (it was really just 1 hour of trading that produced the reading) so that we can’t actually count this RSI bottom as a 2nd.
In terms of time, we’re just over 4 weeks into the decline, which is approaching the average for an intermediate-term decline over the last 3 years (the last one was very short at 3 weeks, and others have lasted up to 8 weeks).
Also of consideration is the extreme complacency that we are correcting. Look again at CPCE in the first chart above. From what I can tell, it set a record for complacency going back to at least the year 1999. This suggests we may have more decline ahead before an extended relief rally. Sentiment has turned negative, but not overwhealmingly so, and it has only been negative for a couple of weeks, so this is not a contraint to a further decline.
One more consideration is the 1930 parallel. Once stocks broke that April after their rally from the crash of ’29, they failed to rally hard for years. The decline was steady all the way down to the bottom in July ’32. In this analalogue, we would have another week or so of choppy and weak rally, followed by the bottom falling out, an outcome that would elegantly resolve our situation. The dip-buyers pile in, but the oomph is gone, momentum weakens and RSI turns down, then BAM, we’re back to SPX 750 this summer.
Prophet charts
I am approaching this situation by being neutral on stocks at the moment. I am holding a core position in December 2011 and 2012 SPY puts and some calls I’m short on IYR and GDX, though I sold a portion of the puts on Tuesday morning and and the rest are hedged with a short in VIX futures (I do this because spreads on options make them costly to trade in and out of). Essentially, I’m flat on equities.
I closed a ton of shorts from last Thursday to Tuesday morning, and went long SPX, ASX and Nikkei futures (and long CHF, EUR, GBP and short JPY and VIX) early this week when I saw divergences in the VIX, currencies and commodities (ie, stock indexes made a new low that was not confirmed with new extremes elsewhere, a buy signal) as well as a glaring RSI divergence on the hourly scale. Those “long risk” positions I closed for profits on Thursday and Friday, since we’ve already corrected the extreme short-term oversold condition and are in neutral territory. Equity-wise, I ended the week where I was on Tuesday morning, since the drop in volitility hurt my puts as much as my various longs made me money. Vol is a bitch that way — sometimes you time prices right, but it’s not enough.
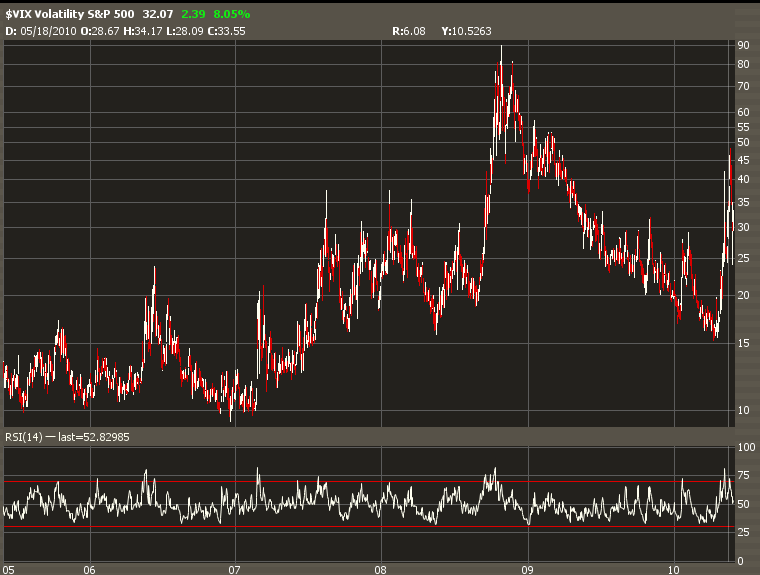
Speaking of the VIX, I think it could settle down for a few weeks, though to a higher level than in April, before the next decline pushes it up again. I think it will remain elevated (as from Oct 2007 onwards) for many more months or a couple of years:
Prophet charts
In the commodity space I’m even more convinced that a major top is at hand, since some trendline breaks have been decisive (platinum, palladium, oil) and the declines have been so violent all around. Commodities tend not to rally as hard as stocks once the trend changes to down, so I entered shorts on oil, silver, gold, palladium and copper near their highs late in the week. The precious metals are looking particularly suspect to me here, and I still think my July 2008 double top analogue is in play.
The euro, Swiss franc and British pound are still looking very weak. Sentiment has been in the dumps for four months now, which is a set-up for a spectacular rally, but judging from their heaviness this week as stocks and commodities and CAD and AUD rallied, I think they may slide to one more low before that rally.


