One year later, a real head and shoulders?

-

Solid deflation trade on today: bonds, yen, dollar up and everything else down. This is hard selling, so it looks like we’re completing the top of the great dead cat bounce of ’09-’10. Once stocks and commodities break May’s lows, they could fall very quickly towards the levels of winter ’09.

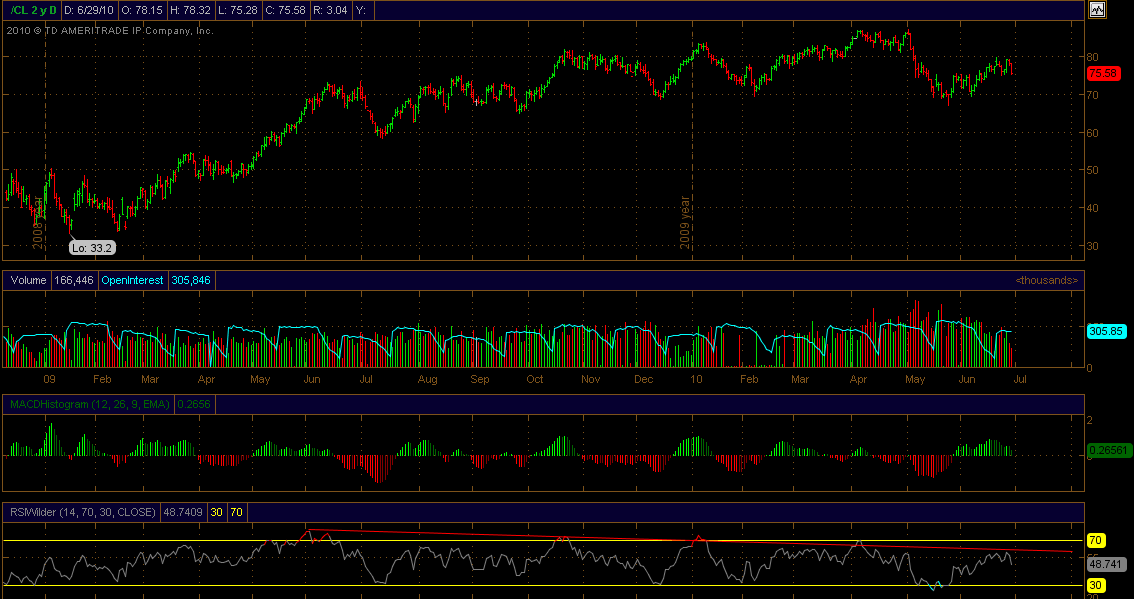
Here’s crude oil, continuous contract futures. This is a beautiful short right now. How quickly the phrase “demand destruction” disappeared from discourse, along with all the other reasons why $35 was a perfectly reasonable price for oil.

Relief rally coming?

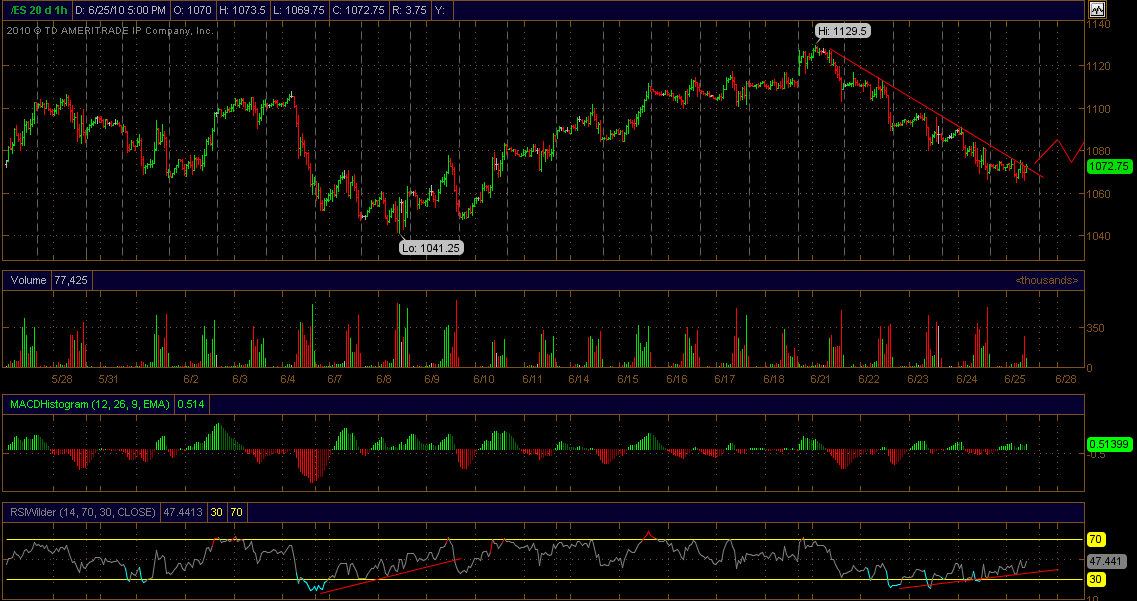
We’ve got a clear divergence on RSI now, as each impulse lower over this week has been weaker than the last. This is a sign to tighten up stops or close shorts. You could make a decent case for a quick long trade here with a stop just under the lows, but on a wider time frame market risk is still very high.

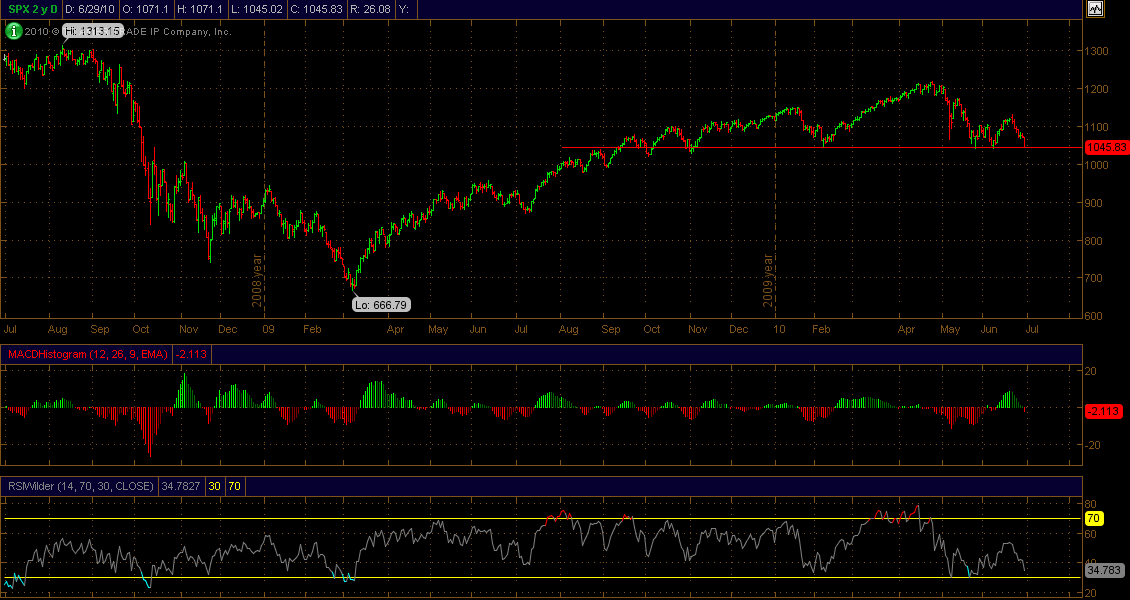
Here’s a chart of SPX futures:

TD Ameritrade

Is the bounce about over?

Glancing around at the commodity and global stock markets, it looks like the bounce from last month’s lows has been adequate to reset psychology for another decline. This is not to say things have to drop this week, but if prices fail to push higher gravity could take over, as the general climate appears to be shifting back to de-risking and deflating (credit downgrades, budget cuts, poor housing sales, lack of hiring, treasury bond strength, etc).

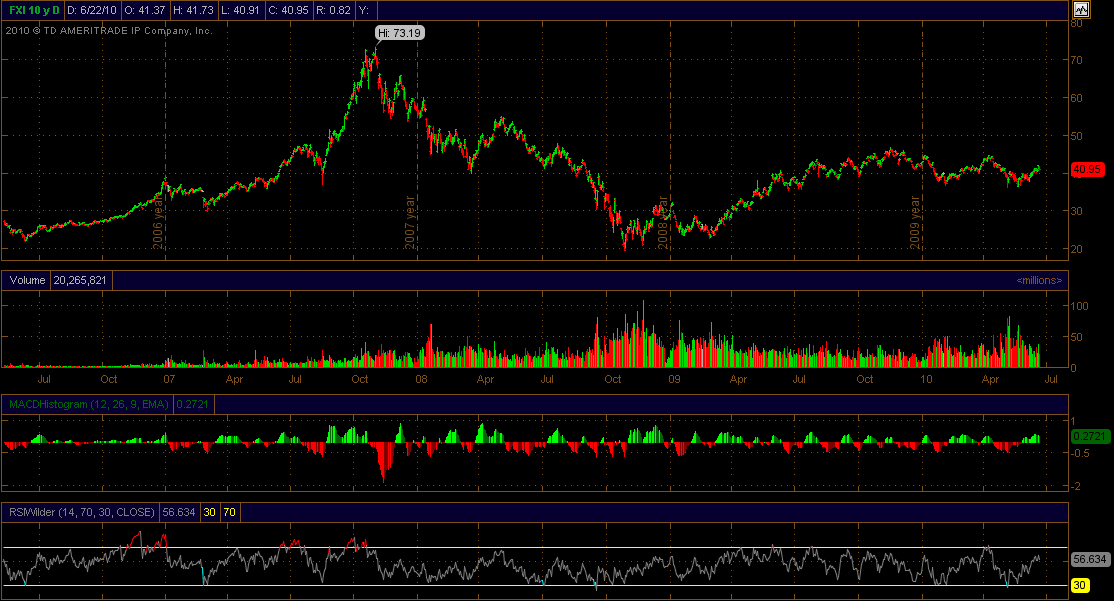
China is the perfect proxy for risk appetite, as it had the biggest stock bubble and action there is linked to gobal consumer demand and industrial commodity prices. Here’s a long-term view of FXI, the ETF of largecap Hong Kong-listed Chinese shares. The big bounce ran out of steam last October, after which prices have made a series of lower lows and lower highs, the definition of a downtrend. Daily RSI and MACD suggest that short-term upside momentum may be stalling:

TD Ameritrade

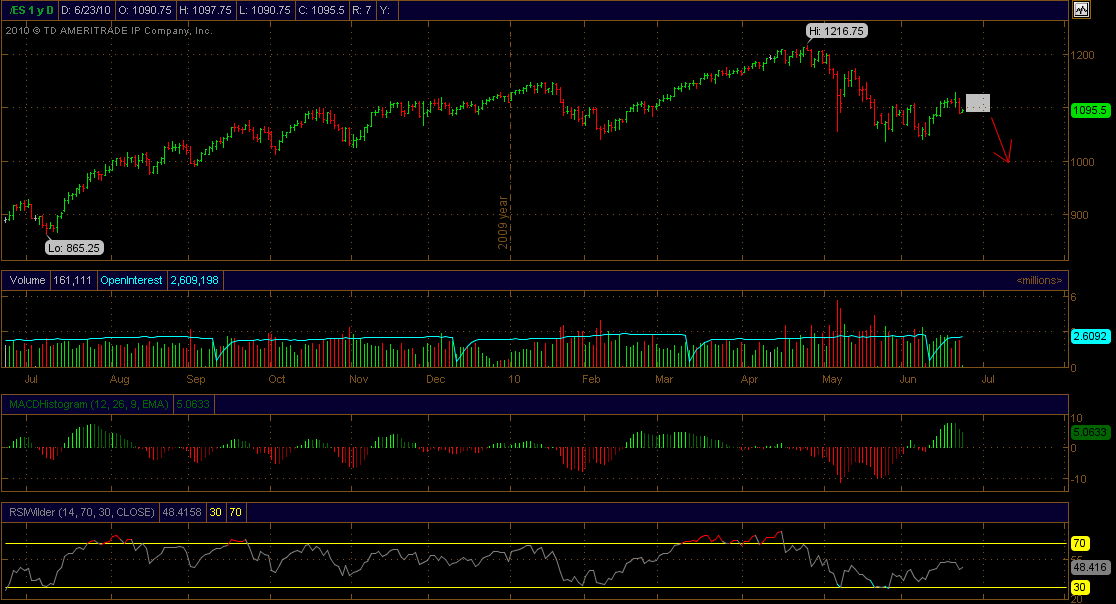
Taking a look at a 4-hour chart of SPX futures (ES), I wouldn’t necessarily expect stocks to keep dropping this week. In fact, it would be somewhat clearer if we got one of those rollercoaster topping patterns over the coming days, where stocks rally and fall by 2-3% for a few times to bleed off the momentum, such as they have done at the last three intermediate-term tops in October, January and April.

-

If SPX sticks to that topping pattern, it could fill the box I’ve drawn below on the daily chart, meaning another try or two at 1130:

-

:

2011 Dividend tax increase cuts real value of S&P500 by 30%.

The S&P 500 is currently yielding about $25.50 per share annually, about 2.3% at today’s level. Sub-3% yields are a characteristic of the bubble years. Before the 1990s an index yield under 3% was very skimpy, hardly justifying the risk of capital loss. Reduced marginal taxation of 15% (with 0% and 5% rates for low-earners) on qualified dividends (meaning on shares held more than 1 year) helped somewhat to justify lower yields, though in the rapid-turnover casino environment after 1995 dividends have hardly mattered to a stock’s performance.

Presuming that the aftermath of the credit bubble has brought a secular value restoration phase (Jim Grant’s term) and growth is missing or anemic, dividends should take greater precedence in investors’ minds. The aging of the developed world should also play a role as retirees opt for safety and income. In this environment, the denominator in the yield equation, share prices, would be expected to adjust downward regardless of any change in tax policy.

To make matters worse, when dividends are subjected again in 2011 to 39.6% federal taxation, prices would have to fall by roughly 30% to offer the same yield, assuming constant dividends. The S&P’s $25.50 yield nets $21.67 this year for a real yield of 2.0%, but to get the same net yield next year either the payout would have to increase to a record $36 or the index would have to fall to 780 (the after-tax net on $25.50 is $15.40 at 39.6%). Although forgotten lately, the stock market’s fundamental value is derived from expected income, so taxation cuts right to the bottom of any valuation estimate.

Dividend payouts remain at the same depressed levels of late 2008 and early 2009, even as earnings have regained lost ground. If and when sales take another turn downward, perhaps aided by cuts in state and local government wages and further layoffs by small businesses, margins and dividends may again come under pressure. With the 10-year treasury bond yielding over 3.25%, where’s the margin of safety in stocks? The 5-year note even yields as about much as stocks, and unlike stock dividends, treasury yields aren’t subject to state-level taxation in the US.

As of today, there are actually some remarkably good yields available from blue-chip stocks such as utilities, consumer staples and tobacco companies. Here’s a list, updated frequently. I’d keep an eye on a few of these. If stocks fall to a level where the after-tax yield looks attractive, I’d be interested in picking up a basket of these for the long-haul. At that point in the cycle the ones with low debt will be among the safest financial instruments you could ever find, since there are productive assets backing that equity — even better if you spread out the political risk across the world.

-

Editorial here: Why raise these taxes (or have them at all), when the revenue derived from them is a tiny portion of the federal ledger and their imposition in all liklihood costs the government (let alone the well-being of the nation) multiples more than they generate, due to lost investment. The government blows the money — it goes down the welfare/warfare rat hole, subsidizing the worst elements at home and abroad.

So why do it? Because the people who make such decisions are either ignorant and idealogically driven (a few, such as Ivy-indoctrinated DC functionaries and academics) or just don’t give a damn about the welfare of the country (the majority). They believe that punitive taxation helps them keep office (it just sounds good to tax the “rich”), and as the balance of the western workforce shifts more and more from production to leaching as government and society age, this is ever more the case.

Iranian central bank dumps euros for gold and dollars.

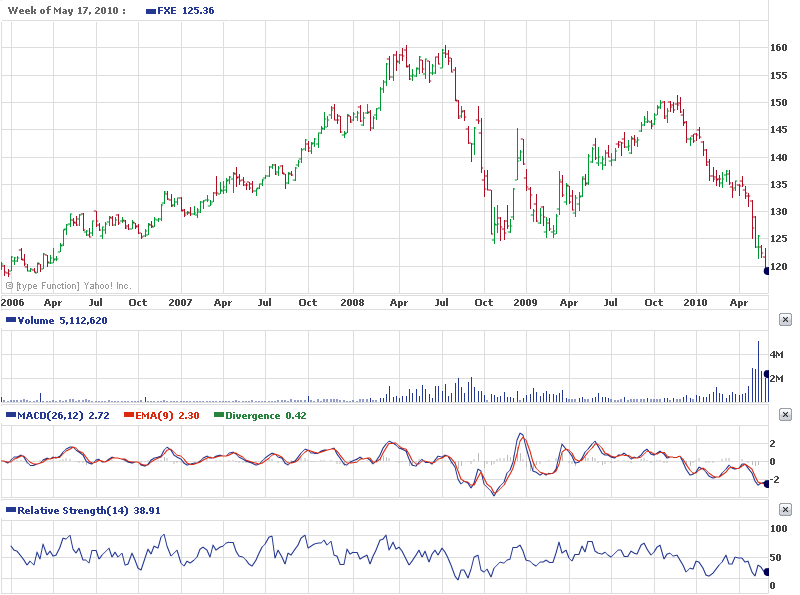
Remember when Iran started pricing its oil in euros instead of dollars? It was April 2008, a few months after supermodel Gisele Bunchen refused payment in dollars. The euro touched $1.60 that month and had nowhere to go but down:

Yahoo! Finance

Having missed out on the dollar’s spectacular comeback, the expert timers in Iran are switching again:

The Central Bank of Iran (CBI) intends on converting about €45 million of its reserves into dollars and gold, Tehran’s media reported.

According to reports, the new monetary policy will be carried out in three phases, with the first phase – converting euro reserves into dollars – already underway.

CBI Chief Mohammad Bahmani hinted of the move in April, saying the Islamic Republic will turn to dollars in view of the euro’s poor performance.

Iran has been converting its currency reserve into euros since 2006 – a move meant to meet both Iranian President Mahmoud Ahmadinejad’s anti-US policies, and the American currency’s weakness.

The recent change stems from the financial crisis which hit the eurozone bloc following Greece’s financial struggles.

The euro-dollar rates have devalued by 20% since the beginning of 2010. Iran’s foreign currency reserves, which are estimated at $100 billion – half of which are in euros – had to sustain the loss.

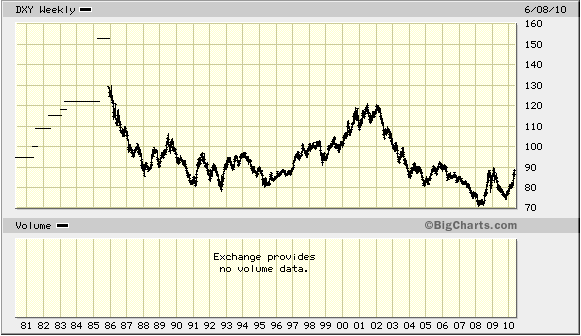
I’m bullish on the euro, CHF and pound in the short term, but long-term bullish on the dollar. Here’s a nearly 30-year historical chart of the dollar index, showing that it has miles of room to run:

bigcharts.com

Gold shifts to negative beta vs. stocks

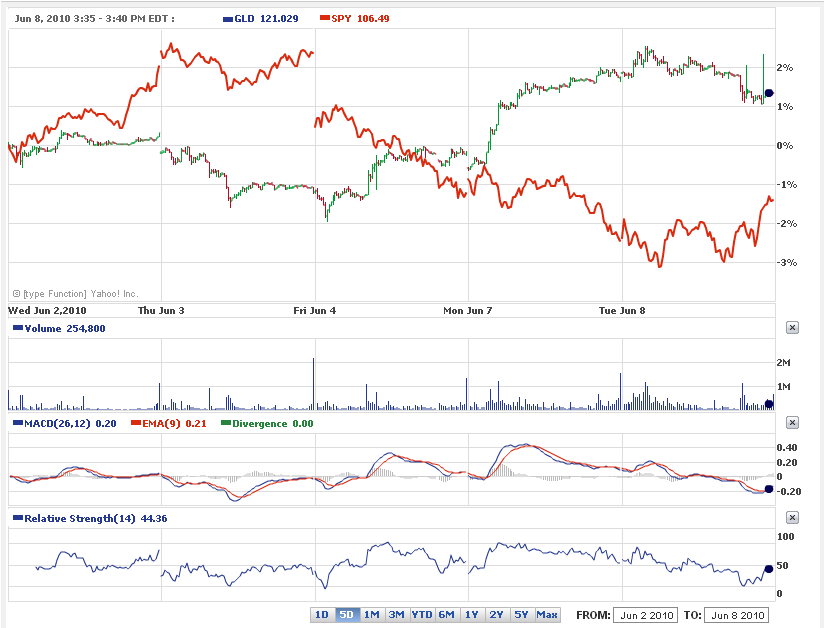
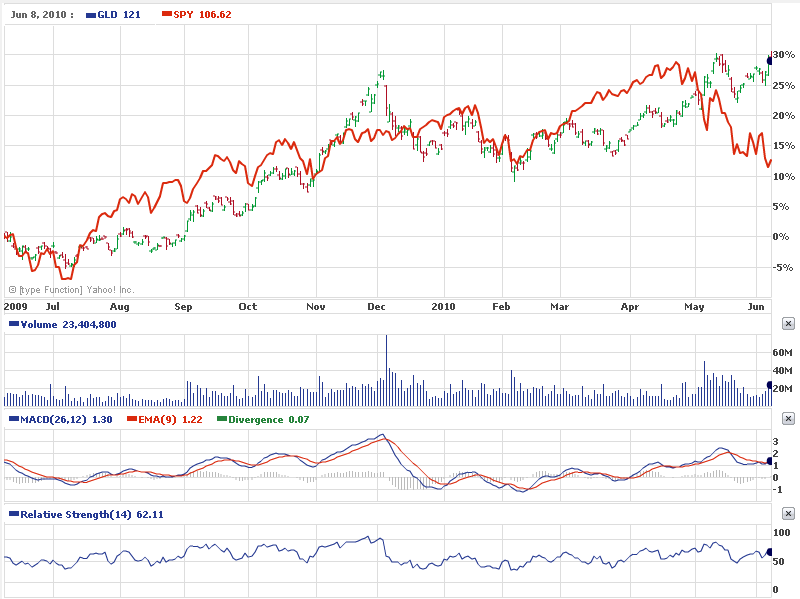
Gold’s correlation with stocks comes and goes — sometimes it’s extremely high, sometimes negative and sometimes it has none at all. It’s been pretty high for much of the last 12 months, but has turned negative since March. At times on a minute-by-minute scale it moves almost tick for tick opposite stocks (much like the treasury bond or Japanese yen).

5-day view:

12-month view:

-
To me, the temporary nature of intermarket correlations means trading each market on its own technicals.

Cops retiring as millionaires

A Forbes blogger does the math:

It is said that government workers now make, on average, 30% more than private sector workers. Put that fantasy aside. It far underestimates the real figures. By my calculations, government workers make more than twice as much. Government workers are America’s fastest-growing millionaires.

Doubt it? Then ask yourself: What is the net present value of an $80,000 annual pension payout with additional full health benefits? Working backward, the total NPV would depend on expected returns of a basket of safe investments–blue chip stocks, dividends and U.S. Treasury bonds.

Investment pros like my friend Barry Glassman say 4% is a reasonable return today. That’s a pitiful yield, isn’t it? It is sure to disappoint the scores of millions of baby boomers who will soon enter retirement with nothing more than their desiccated 401(k)s, down 30% on average from 30 months ago, and a bit of Social Security.

Based on this small but unfortunately realistic 4% return, an $80,000 annual pension payout implies a rather large pot of money behind it–$2 million, to be precise.

That’s a lot. One might guess that a $2 million stash would be in the 95th percentile for the 77 million baby boomers who will soon face retirement.

Cops have a better racket these days than during prohibition. It’s not just cops, either — millions of teachers, firefighters, administrators, transit workers, janitors and all kinds of unionized government employees are effectively millionaires.