Keynes vs. Hayek, Round 2

I like how at the end Keynes is pulled up to his feet and declared the victor (no matter how obvious a failure, the corrupt system keeps applying his theories). Then the Washington mandarins, Wall Street bigwigs and press all gather around him while the nerds come to congratulate Hayek. The press often implies that the Wall Street crowd loves Hayek and laissez-faire (“unrestrained markets” and all that), when in reality the moneyed political players support intervention since they are successful rent seekers and bailout recipients.

The key point that well-intentioned supporters of government (like most everyone in Europe) often miss is summed up in this phrase from Hayek:

“With political incentives, discretion’s a joke.
Those dials they’re twisting, just mirrors and smoke.”

-

For those who haven’t seen it, this is the first video:

-

And the real Hayek on Keynes:

Max caution alert: exit or hedge all market risk

This is one of those times where markets are stretched to the limit and any further upside will be minimal in relation to the extreme risk entailed. Sentiment has been dollar-bearish and risk-bullish for so long that a violent reversal is all but guaranteed. This is not to say that the absolute top is in, but that at the very least, another episode like last April-June is coming up.

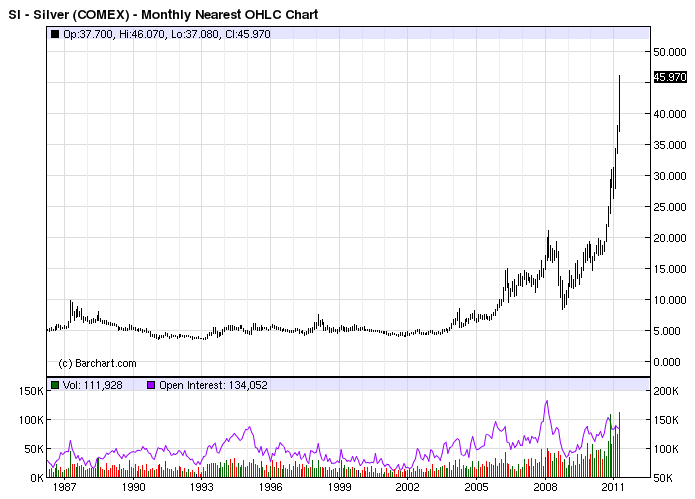
Watch for a sharp sell-off in stocks, commodities and the EUR-CAD-AUD complex. Even gold and silver are vulnerable, especially silver. We could be near a secular top in silver, where the recent superspike has all but gauranteed an unhappy ending to what has been a fantastic technical and fundamental play for the last decade. Gold is much more reasonably valued and should continue to outperform risk assets because the monetary authorities are so reckless, but there is just too much froth in silver to hope for even that.

The rally since early 2009 has been not just another dead cat bounce in the bear market from 2007 (like I thought it would be), but another full-blown reflation and risk binge like the 2003-2007 cyclical bull. The secular bear since 2000 is still here, and valuations and technicals suggest that another cyclical bear phase is imminent. There is no telling how long it will take or how it will play out, but the only prudent move at times like this is to take all market risk off the table. Bears still standing should think about going fully short. Anyone holding stocks should sell or get fully hedged. History shows that the expected 10-year return on stocks from conditions like this is under 3.5%, and such a positive figure is often only acheived after a major drawdown and rebound. See John Hussman’s excellent research on the topic of expected returns from various valuation levels: http://hussmanfunds.com/weeklyMarketComment.html

Want to know what a secular bear looks like? Check out 1966-1982: a series of crashes and rallies that resulted in a 75% inflation-adjusted loss. In the absense of 70s-style inflation, this time the nominal loss should be closer to the real loss. Think Japan 1989-who knows?

The headlines this time around should have less to do with US housing, though that bear is still raging. We’re likely to hear much more about European sovereign debt, where haircuts and defaults need to happen, and Canadian, Australian and Chinese real estate. When the China construction bubble pops it will remove a major fundamental pillar from the commodities market.

There is no safe haven but cash, and cash is all the better since everyone has feared it for so long. If I had to build a bulletproof portfolio that I was not allowed to touch for five years, it would be something like this: 20% gold bullion, 25% US T-bills, 25% US 10-year notes, 25% Swiss Francs (as much as I hate to buy francs at $1.13) and 5% deep out-of-the-money 2013 SPX puts (automatic cash settlement).

There will be a great value opportunity in stocks before long (the tell will be dividend yields over 5% on blue chips). It’s just a matter of having the cash when it comes, so that you aren’t like the guy who said in 1932 that he’d be buying if he hadn’t lost everything in the crash.

-

PS – For those of you who think QE3,4,5,6 will save the markets, I’ll counter that it doesn’t matter, not on any time frame that counts. Risk appetite and private credit are what matter the most, and the Fed can’t print that. At 3AM, spiking the punchbowl doesn’t work anymore.

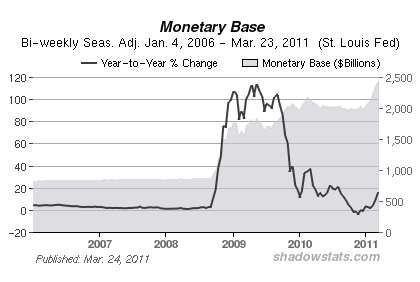
Or I can put it this way: the Fed has increased the monetary base from 850 billion to 2500 billion since 2007. Have your bank balance, salary and monthly bills increased 200%? If not, why should stock and commodity prices? Not even Lloyd Blankfein is 200% richer than four years ago.

Silver superspikes: dollar-bullish, and they don’t last

First, the 25-year monthly chart:

-

Here’s a chart that goes back further but only goes up to 2010 (I couldn’t figure out how to get barchart.com to draw me the whole thing, but you can just use your imagination – the line just goes straight up from $30 to $45):

-

Gold’s march upwards has been much more orderly, but silver is a thin market and prone to spikes. These things are tough to short, and to attempt to do so you should wait for a pause and use a stop above the highs, but even with a stop a fast market like this could spike dollars in minutes or seconds and close you out at a big loss only to reverse. This chart doesn’t show the action that happened intraday one day in Jan 1980 when silver traded over $50 very briefly.  No reason why it couldn’t spike to $70 next week only to crash and languish at a new normal of $10-20 for the next two decades.

It is safer in a way to buy puts than to short SLV or sell futures, since your risk is defined – you can only lose what you put up. The July 35-strike puts on SLV were going for less than 60 cents on Wednesday, and will get cheaper every day until silver falls. June 35s are under 40 cents and will decay faster but pay off better in a crash. At any rate, I’d take a disciplined approach and figure on losing my premium at least once, buying higher strikes if the spike continues upwards. Losing the first premium or two would be acceptible if a later position pays off 10:1.

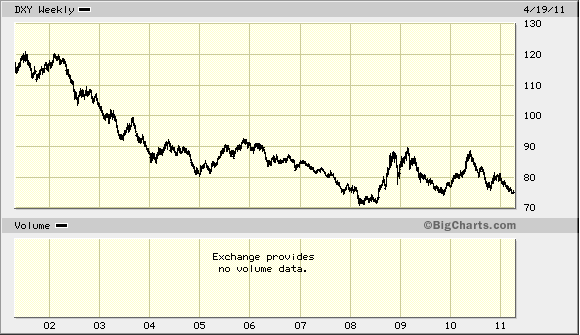
Take another look at this long-term dollar chart. We had a major bottom in 1980 just as everyone was panicking into precious metals.  Silver spikes are apparently another symptom of extremely negative dollar sentiment, so should be considered bullish for the currency.

-

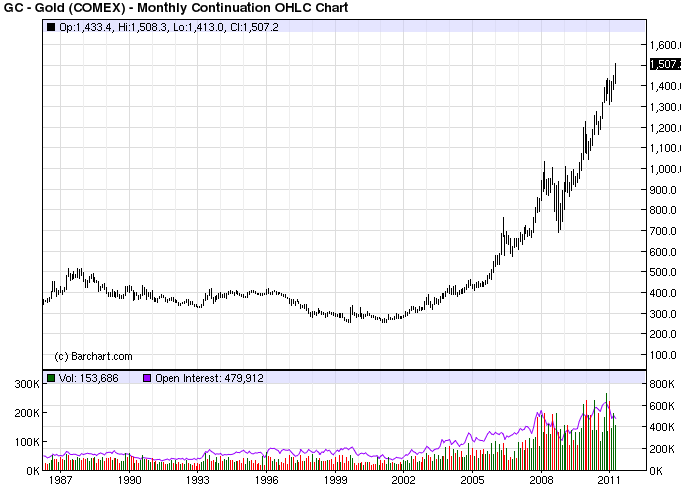
BTW, though gold’s price and action is much more sensible, the silver spike is very bad for gold as well – it may just have doomed its bull market. The metals have more than adjusted for the inflation of the last 30 years and the money printing of the last 3. It would make sense for their run to end soon and for them to settle into some middle ground. That doesn’t mean gold can’t touch 2500 and silver can’t hit 100 – it’s just that these moves are too fast and too high relative to their historic multiples to other assets, so these prices will not last.

Long-term gold charts (first one is a few weeks old – the second is current but doesn’t go back as far):

The dollar’s going to crash, the dollar’s going to crash!

Uh, it already has. The time to be shouting about a crash was 2000, but the dollar-crash meme only got mainstream in late 2007. As you can see in this 10-year chart of the trade-weignted dollar index, the dollar had by then already fallen, and is no lower today than 3 years ago. It may be putting in a triple bottom prior to a secular bull market. The sentiment has certainly been negative enough for long enough to set up a lasting upturn, and the price action in recent years is similar to that of the late 80s to early 90s.

-

EDIT: Here’s a 30-year dollar index chart.

-

A secular bull market in the dollar would coincide with more unwinding of risk assets, since the buck has been a favored short for the carry trade (it is weak vs. other currencies, and has very low borrowing costs).

It would also make sense for US Treasury rates to finally put in their secular bottom during the dollar’s bull market, but not in the first phase. Interest rates follow a very long cycle, with the last top in the early 1980s and the last bottom in the early 1940s. Sentiment is still too anti-bond, and there is still too much credit unwinding to come for me to believe that bonds are ready to start falling. Bonds, after all, are hard cash for big players, and people reach out the curve for yield as short-term rates compress during credit stress.

I never thought I’d agree with Joe Stiglitz.


This essay is a must-read that will change your view of how a market economy works:

WALLINGFORD, CT—Upending more than two centuries of free-market theory, leading economists across the globe announced Thursday that the fundamental principles of capitalism had been “irrefutably disproved” by the continued existence of the designer fruit-basket company Edible Arrangements.

According to experts, the Connecticut-based franchise, which arranges skewered pieces of fruit into displays vaguely resembling floral bouquets, has defied all modern economic models, expanding continuously for the past decade despite its complete lack of any discernible consumer appeal.

“In theory, the market should have done away with Edible Arrangements long ago,” said American Economic Association president Orley Ashenfelter, who added that one of the crucial assumptions of capitalism is the idea that businesses producing undesired goods or services will fail. “That’s how it’s supposed to work. Yet somehow, despite offering no product of any worth whatsoever, this company not only makes payroll every week, but also generates strong profits.”

“To understand this enigma, we must discard the naïve notion that free-market prices reflect what consumers are willing to pay,” Nobel laureate Joseph Stiglitz said. “Otherwise, how else are we to rationalize the phenomenon of a human being willingly spending 84 bucks on 18 green apple wedges and a Mylar balloon?” …

Even many of the nation’s staunchest neoliberal economists, who have long advocated laissez-faire policies, acknowledged that the ideas of F.A. Hayek, Ludwig von Mises, and Milton Friedman cannot account for how Edible Arrangements operates from more than 1,000 locations in 13 countries, including Hong Kong, Italy, India, and Kuwait…

Harboring doubts that such a business could generate $200 million in annual revenue, the Department of Commerce last year launched an investigation into whether Edible Arrangements served as a front for some sort of illicit trade. Internal reports reveal agents uncovered nothing illegal, and were instead “absolutely stunned” to find real, functioning storefronts with paid employees, computers for tracking actual orders, and stockrooms packed with honeydew melon balls and pineapple slices cut into the shape of butterflies.

“It defies all logic,” Commerce Secretary Gary Locke said of the company’s gift bouquets. “These things are like six pounds of cantaloupe—who could possibly eat that much? And they’re already cut up, so you have to eat them quick or throw the whole thing out. For Christ’s sake, Americans don’t even eat fruit.”…

“Right now, we just have to accept the fact that Edible Arrangements exists and is, somehow, a part of our current economic reality,” said Ashenfelter, while perusing the company’s online store. “Besides, my mom’s birthday is coming up and, now that I’m seeing these, I think she might really like this one with the teddy bear on it.”

-

There was one of these next to my building in New York, and it always did make me wonder.

Inflation, deflation & the dollar – where do we stand?

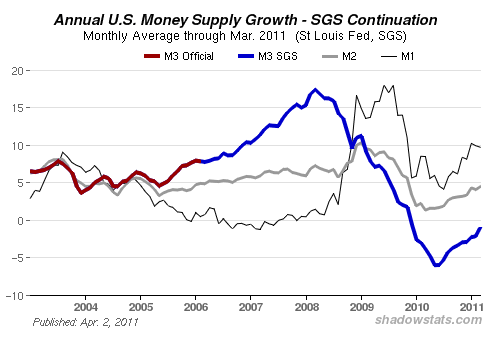
We have had inflation since late 2009, using my favored definition of inflation as an increase in money supply and credit from Mish. By the way, commodity prices change with the speculative whims of of the financial markets, and are not a good definition of inflation (commodities fell from 1980 to 2000, as we experienced credit & monetary inflation and the price level doubled).

Since 2007, the monetary base has of course soared (see below), but in 2008 and 2009 its increase was overwhelmed by the decrease in private debt (marked-to-market), and the mood of risk-aversion. Since then defaults have eased and new debt issuance has grown, so we have had significant inflation.

Monetary base:

shadowstats.com

Monetary Aggregates:

shadowstats.com

The world is still laden with too much debt to sustain, so we will likely be back into deflation and de-risking before long. The following debtors in particular have yet to have their come-to-Jesus moments:

  • US cities & states (muni-bonds)
  • Canadian and Australian homeowners (record high prices, prices too high relative to incomes and rents, absurd loan-to-value ratios).
  • Several European nations (Portugal, Spain, Italy, much of Eastern Europe). Actually even Greece and Ireland will have to default before long, since their bailouts were just extensions and added to their debt.

The Kondratieff cycle is not perfect, but its main point is that debt cycles are generational, since they have as much to do with attitudes as with numbers. The deflation/de-leveraging phase (winter) can last over a decade, and this one certainly looks like it will.

Previous recent generations were as follows, off the top of my head:

  • Winter: 1929-1940 (decrease in debt, falling assets, low interest rates, falling to stable prices)
  • Spring: 1940-1966 (early debt growth, rising assets, rising interest rates, moderately rising prices)
  • Summer: 1966-1982 (continued debt growth, falling assets, high interest rates, rapidly rising prices)
  • Autumn: 1982-2007 (rapid debt growth, rapidly rising assets, falling interest rates, slowly rising prices)
  • Winter: 2007- (decrease in debt, falling assets, low interest rates, falling to stable prices)

The dates are approximate – some say that winter began in 2000 when we first faced deflation. Also, all nations are not in sync. Japan went into winter in 1990, and is still in it despite massive and repeated central bank printing.  What clears the way for spring is the reduction in debt, and the west is making the same mistake that we criticised the Japanese for making, propping up failed institutions and not allowing the market to clear.

-

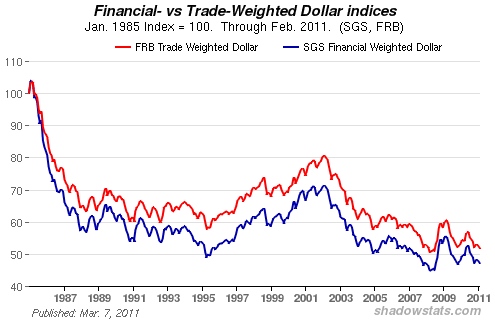
Bonus chart: US dollar index since 1985 – in classic form, by the time everyone started worrying about a dollar crash (2007), it had already happened.

shadowstats.com


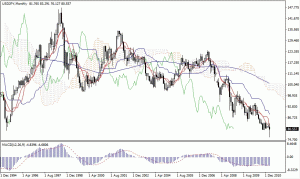
Despite its central bank’s profligate ways, the Japan’s currency has risen dramatically since the 1990s. Don’t count the dollar out just yet. This chart shows yen per dollar (downward slope = rising yen):

.

.

.

Major dollar rally coming soon, to a trading screen near you.

Sorry for my long hiatus from blogging. I’ve been trading very little over the last six months, demoralized and righly so due to chronically awful trade execution and overreaching. I have a highly valid reversal strategy, but it is not a trend strategy, and I need to keep my bearish macro views out of the equation (though I suspect that they would be better suited to the next 2 years that the last 2 – but I need to forget about that and keep such discussions academic, for risk of corrupting a perfectly good trading model).

I’ve done some soul-searching and review of my trading history and this blog, and come to the conclusion that I should not abandon this pursuit but instead work to remedy my fatal flaws. A review of my history shows that I am able to identify turns in markets with a very high degree of probability. The fatal flaws are not analytical, but as is usually the case, emotional and procedural. This blog actually has a very good record of both initiating positions and closing or reversing them. As a trader, I would have done well to follow its advice, but I would often revert back to my bear bias, and way too soon, as when I shorted risk last March-April, booked huge profits and went long (including buying bottom tick in EUR and CHF) in June, only to reverse and go short again in July on bias alone without my proven criteria for a valid set-up.

My basic methodology as it has evolved here since August 2008 when this blog began, is to use sentiment and technical data to identify oversold and overbought conditions that are long in the tooth and due for clearing reversals.

The classic set-up is like this:

  • DSI sentiment has plateaued or bottomed at an extreme (<20% or >80% for at least 5 weeks, the longer the better – this can go on for 6 months at the outside, more commonly 4-12 weeks if we are talking <20% or >80% readings).
  • A major move comensurate with that sentiment has occurred (the market is trading at highs or lows), which to the mass of traders seems totatally justified by fundamentals.
  • Price action shows weakening momentum. This is indicated by a diverging trend in oomph indicators MACD and RSI. This usually means that the rate of change is slowing and that each new little push is slower and on lower volume, even as new extremes in price are reached.
  • A loose stop-loss level can be identified (a level that should it be broken decisively, would indicate that the prevailing trend still has legs). This is a mult-week strategy, so stops should use daily or even weekly levels — no use for 5 minute charts here.
  • Markets are highly coordinated in recent years. E.g., if the dollar is looking like it is going to rally, don’t be long stocks or commodities or short bonds.
  • Adjust stops downward to breakeven after the reversal, and tighten stops to a gain as DSI data reaches 40-60% middle ground.
  • Tighten stops much more or close positions after DSI data approaches the opposite extreme (e.g., if you shorted SPX when DSI bulls were 90%, prepare to close and consider the trade finished once DSI reaches 25%).
  • This is not a trend system! Repeat, this is not a trend system! Trade reversals only, as those have the highest probability. Once the oversold/overbought condition is cleared, the probability of the market continuing in your direction is vastly lower, and does not justify the risk (no matter your opinion of the longer-term situation or fundamentals). This last point was my fatal flaw.
So, we have a classic long-dollar set-up developing right now. I give it strong odds that we experience a major dollar rally within 2 months, with all of the de-leveraging that entails in other markets. This is not the place to put on a heavy position if you are not willing to accept big drawdowns, since this market could easily trend for a while yet, with the stock markets holding up as well.
-
source: futures.tradingcharts.com
-
Note that this trade is confirmed by the opposite in the stock market. Plateau in DSI and other sentiment indicators at a high level of bullishness for several weeks. This condition will be cleared to the downside as the dollar breaks upward. Copper, oil, etc will also correct hard down, and the anti-dollar currency pack (CAD, GBP, EUR, AUD and probably CHF) will fall as well. Not sure about JPY – it often trades up with the dollar during these little episodes of risk unwinding.
.
As always, the timing is the most uncertain factor here, but the longer the dollar sentiment stays low, the less risk there is in this trade and the stronger the resulting rally will be. I can’t say whether this will come next week or in early June, but we are at the point where traders should be nervous about short-dollar, long-risk positions, because that trade is running on momentum alone and meets the requisites for sudden reversal.
.
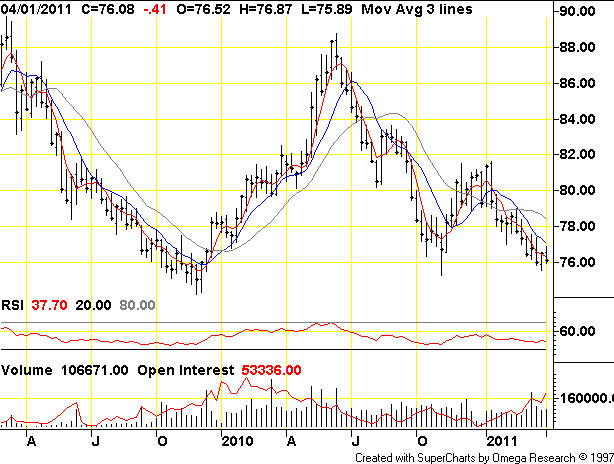
The archetypal set-up was long-dollar in fall 2009, after dismal trader sentiment since early June 09. The set-up was in place by late August, but the dollar continued to drift down through November, helped along by small clearing rallies and brief upticks in sentiment. Because average sentiment was low for an extraordinarily long time (6 months), we had a very powerful rally, from 74 to 88, over the following 6 months. This time, sentiment has been low for two months so far, certainly enough for a good rally, but not necessarily for the same killer trade. On the other hand it is somewhat better because the readings are more extreme.
.
The clearing episodes are the wall of worry or the slope of hope that keep the trend going.  A smoothy trending market with a flattening slope is more dangerous for followers and better for reversal traders. So far we have such a market, but if it gets choppy, with little sell-offs in stocks and small dollar rallies, it can last longer, and if the clearing events are big enough, it would cancel this trade. There will be others.