
In my book, the best long-term market statistician is mutual fund manager John Hussman, whose free weekly column is more valuable than any high-priced newsletter.
Using a century of data, there is a very strong pattern of declines from a simple set of conditions. I’ll let Hussman explain them:
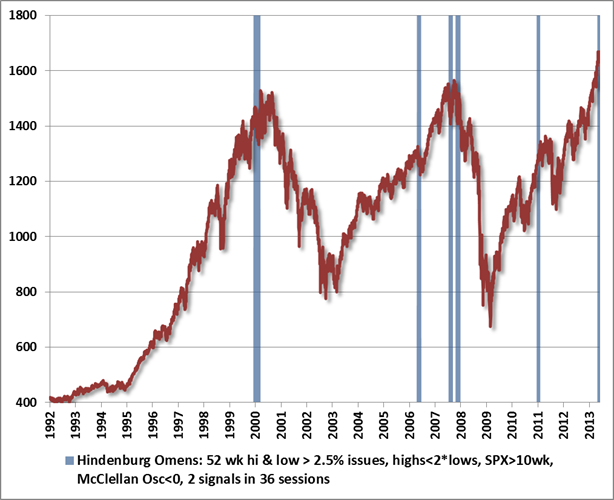
In the chart below, the bars indicate points in the past 20 years where the following conditions were true.
- NYSE 52-week highs and lows both greater than 2.5% of total issues traded (composite highs work better than equity-only, because dispersion of interest-sensitive issues is often meaningful);
- New highs no greater than twice the number of new lows;
- S&P 500 greater than its level of 10-weeks earlier (some versions use the NYSE composite, but our index of interest is generally the SPX, and we are less interested in signals that might occur when the market is already down substantially);
- McClellan Oscillator (the 19-day minus the 39-day smoothing of daily advances minus declines on the NYSE) below zero, which is another indication of dispersion;
- Two signals within 36 trading sessions, which is helpful for reducing one-off noise.
Ominous? Not necessarily. Worth considering in the context of a much more troubling syndrome of overvalued, overbought, overbullish, rising-yield conditions? Sure.
Furthermore, the extreme in valuation (Shiller PE over 23 on record margins – Shiller PE on normalized margins would be closer to 29) means that regardless of the near-term outcomes, the returns of future years have been cannibalized. Because earnings grow remarkably steadily over the long-term (6% nominal is the average) stock market returns depend overwhelmingly on the price paid for a claim on these earnings. With the brief exception of the mid 1990s, 10-year returns have never been favorable when the S&P500 trades over 20x 10-year average earnings.
Furthermore, the Shiller PE appears to still be correcting from the late-90s bubble. We should welcome this trend, since valuations have in the past overshot to the downside. By the way, the previous examples of seriously undervalued markets all occurred after high inflation during the later years of secular bears (1917-1920, 1940s, 1977-1982).
A Shiller PE of 10 within a few years would fit nicely in this chart, though it would not be a pleasant experience getting there. Today, Shiller earnings are about $70.

