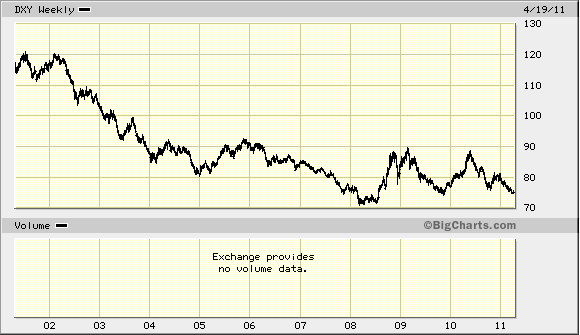
Uh, it already has. The time to be shouting about a crash was 2000, but the dollar-crash meme only got mainstream in late 2007. As you can see in this 10-year chart of the trade-weignted dollar index, the dollar had by then already fallen, and is no lower today than 3 years ago. It may be putting in a triple bottom prior to a secular bull market. The sentiment has certainly been negative enough for long enough to set up a lasting upturn, and the price action in recent years is similar to that of the late 80s to early 90s.
-
EDIT: Here’s a 30-year dollar index chart.
-
A secular bull market in the dollar would coincide with more unwinding of risk assets, since the buck has been a favored short for the carry trade (it is weak vs. other currencies, and has very low borrowing costs).
It would also make sense for US Treasury rates to finally put in their secular bottom during the dollar’s bull market, but not in the first phase. Interest rates follow a very long cycle, with the last top in the early 1980s and the last bottom in the early 1940s. Sentiment is still too anti-bond, and there is still too much credit unwinding to come for me to believe that bonds are ready to start falling. Bonds, after all, are hard cash for big players, and people reach out the curve for yield as short-term rates compress during credit stress.


