Even for a guy who went into 2008 with half his net worth in put options, this is stunning to watch unfold.
Here are a series of 3-month charts that show the shift in mood from August’s complacency and hope to today’s moderate terror:
-
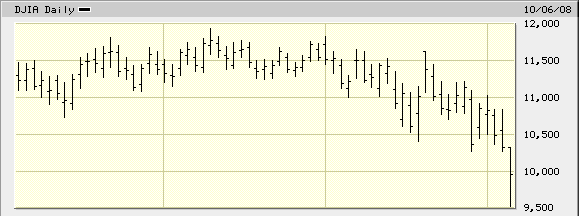
Worry, worry, worry…PANIC.
The Dow. Look at the bottom drop out today:
Bigcharts.com
-
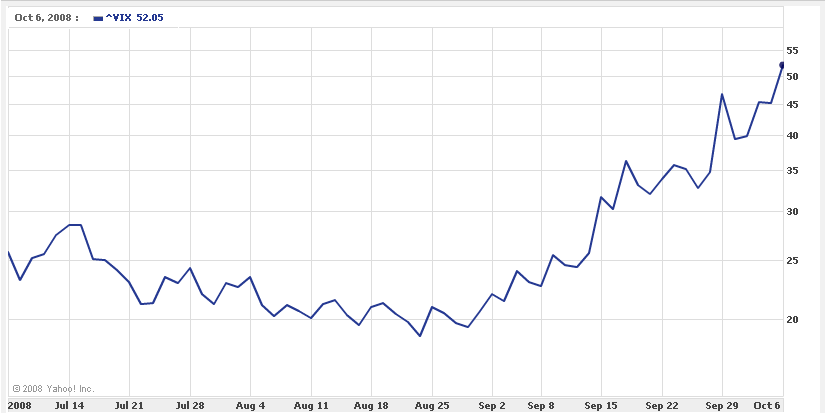
Insurance gets expensive after the storm rolls in.
CBOE Volatility Index (only ‘87 was higher):
Yahoo! Finance. Click image for larger view.
–
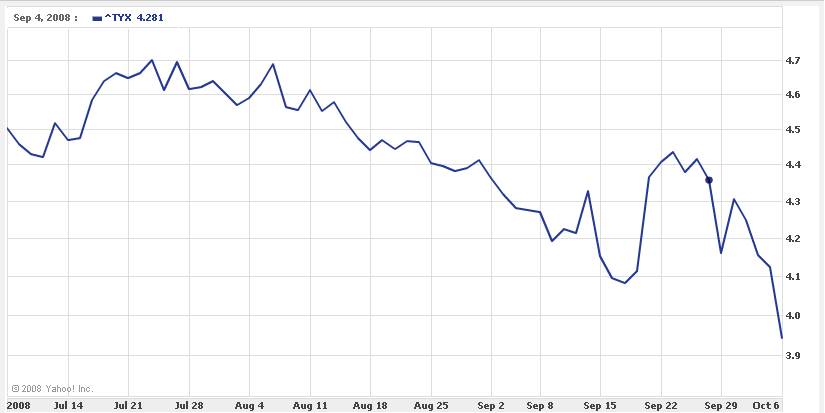
Getting ahead of the curve.
30-year Treasuries broke solidly through 4%:
Yahoo! Finance. Click image for larger view.
-
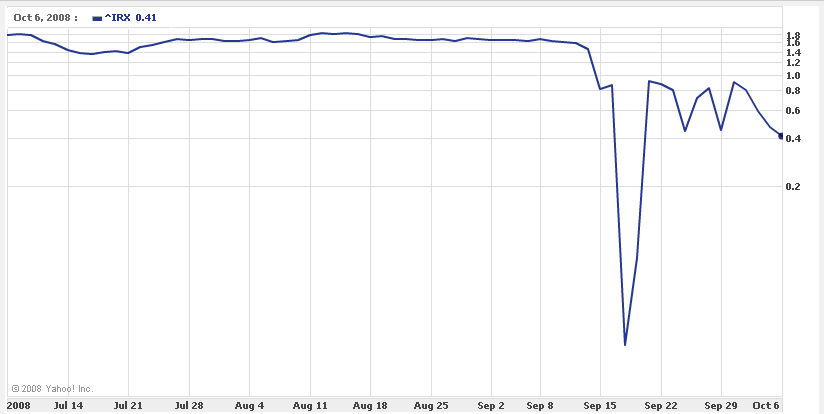
Who says cash is trash?
90-day T-bills. They would have stayed lower if Paulson hadn’t bailed out MM funds:
Yahoo! Finance. Click image for larger view.
-
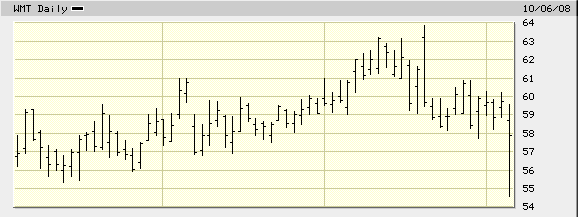
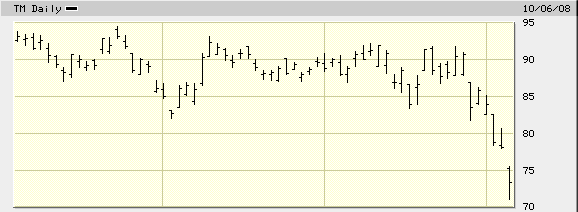
No stock is immune:
Wal-Mart:
Bigcharts.com
Toyota:
Bigcharts.com
-
After the strength and breadth of what we saw today, I don’t think even this stage of the panic is over. Today I sold off most of my near-term puts, since I don’t like to press my luck, but I’m still holding a boatload of 2010s.
This is just the beginning of the middle. You’ll know we’re near the end, years from now, when stocks drop 5% in a day and it doesn’t even make headlines since nobody is in the market anymore.
——–
Today was an historic day, but nothing out of character for the bursting of an historic credit bubble. It was like all the other down days, only more so. There will be more to say, but I’ve been up since 4AM and need some sleep.
- Tags: crash, panic, treasuries
Most Viewed Posts
- Add mortgages to the debt bubble (with junk bonds, munis, sovereign debt…) - 17,309 views
- Treasury-only money market funds - 14,911 views
- The next bubble: cash. - 14,259 views
- 90 day T-bill rate drops to 0.23%. What’s next, negative yields? - 11,819 views
- Inverse ETFs vs. LEAPS puts - 10,930 views
- Why bailouts will not stop the depression - 9,349 views
- About - 8,711 views
- Listen to the people who predicted this: No bailouts, no New Deal, no serfdom. - 8,012 views
- Commodities bubble bursting - 7,721 views
- On Black Thursday, 1929, the Dow closed down 2%. - 6,891 views
Recent Posts
- Nov 11, 2011 - Great little speech at EU: fire the bureaucrats & restore national sovereignty
- Nov 11, 2011 - Americans love war
- Nov 9, 2011 - Hussman: recession imminent
- Sep 20, 2011 - EBT rap video
- Sep 11, 2011 - Dick Cheney’s favorite holiday
- Aug 19, 2011 - A look at the real value of gold on an historical basis.
- Aug 18, 2011 - The material living standards of US rich vs poor, and the politics of envy.
- Aug 11, 2011 - In candid moment, Bernanke lets out the truth
- Aug 11, 2011 - If S&P’s downgrade actually matters, why are bonds up?
- Aug 1, 2011 - Farewell, Sheila Bair, and thank you (and FU Paulson, Bernanke & Geithner)
- Jul 25, 2011 - Europe’s dead stock markets
- Jul 25, 2011 - Rumors of dollar’s death greatly exaggerated
- Jul 4, 2011 - DSK all but cleared; no surprise here.
- Jun 24, 2011 - Jim Grant on Ben Bernanke
- Jun 7, 2011 - Kyle Bass and Hugh Hendry on shorting Japan
Recent Comments:
- A look at the real value of gold on an historical basis. - GolfBoy: Never mind - found it here:...
- A look at the real value of gold on an historical basis. - GolfBoy: Please, anyone - what is the historical...
- EBT rap video - Quentin Perrin: Hi, Sorry I write you via comments. But I could not find contact e-mail or feedback...
- EBT rap video - Linus Huber: SCARE 20.12.2012 (Stop Corruption and Repression Effective 20.12.2012) Banks were given...
- EBT rap video - steveo: Hawaii Trading and Breakpoint Trades (BPT) is providing a free newsletter on Commodities....
- At last, NYC rental and condo markets softening - Nicole Cervantes: Does any one know some one using web fame service...
- Toppy action in dollar index, another rally in stocks coming? - fireboy and watergirl: I like this site it’s a...
- A look at the real value of gold on an historical basis. - bobby: Hi Mike, I was wondering what you think of the...
- A look at the real value of gold on an historical basis. - Bjorn: Thanks Mike, that’s very helpful
- A look at the real value of gold on an historical basis. - Mike: BTW, if you are looking for high put prices, those...


Leave a reply