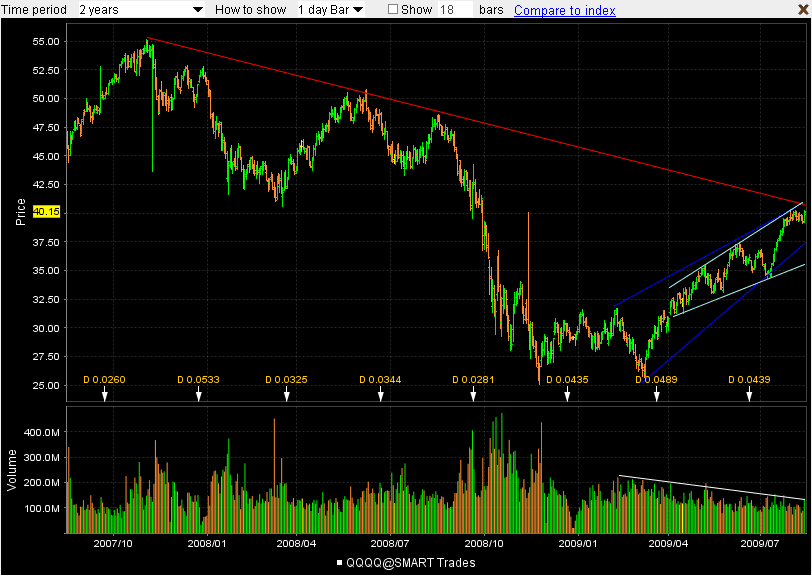
2-year view of QQQQ here (Nasdaq 100 ETF):
Image: Interactive Brokers
-
Red: Trendline from 10/07 peak across June and Sept 08 peaks.
Light blue (nice fit): rising broadening wedge
Dark blue (maybe a stretch here): rising tightening wedge
White: Declining volume since start of rally, an unambiguous warning not to trust it.
Hat tip to Jim at slopeofhope.com for noticing the wedges.
-
As for the failed head and shoulders pattern that we saw a few weeks ago, Edwards and Magee had this to say (Technical Analysis of Stock Trends, 9th ed., p62):
There is one thing that can be said and is worth noting about Head-and-Shoulders Formations that fail completion or produce false confirmations. Such developments almost never occur in the early stages of a Primary Advance. A Head-and-Shoulders that does not “work” is a warning that, even though there is still some life in the situation, a genuine turn is near. The next time something in the nature of a Reversal Pattern begins to appear on the charts it is apt to be final.
-
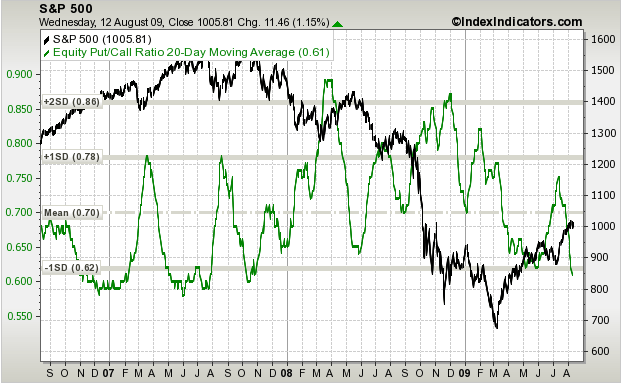
And without comment, here’s the 2-year view of the S&P vs. the 20-day average Equity Put/Call ratio:
indexindicators.com

10 Responses to “A little morning TA”
Leave a reply
Most Viewed Posts
- Add mortgages to the debt bubble (with junk bonds, munis, sovereign debt…) - 17,226 views
- Treasury-only money market funds - 14,699 views
- The next bubble: cash. - 14,130 views
- 90 day T-bill rate drops to 0.23%. What’s next, negative yields? - 11,720 views
- Inverse ETFs vs. LEAPS puts - 10,869 views
- Why bailouts will not stop the depression - 9,281 views
- About - 8,618 views
- Listen to the people who predicted this: No bailouts, no New Deal, no serfdom. - 7,975 views
- Commodities bubble bursting - 7,707 views
- On Black Thursday, 1929, the Dow closed down 2%. - 6,860 views
Recent Posts
- Nov 9, 2011 - Hussman: recession imminent
- Sep 20, 2011 - EBT rap video
- Sep 11, 2011 - Dick Cheney’s favorite holiday
- Aug 19, 2011 - A look at the real value of gold on an historical basis.
- Aug 18, 2011 - The material living standards of US rich vs poor, and the politics of envy.
- Aug 11, 2011 - In candid moment, Bernanke lets out the truth
- Aug 11, 2011 - If S&P’s downgrade actually matters, why are bonds up?
- Aug 1, 2011 - Farewell, Sheila Bair, and thank you (and FU Paulson, Bernanke & Geithner)
- Jul 25, 2011 - Europe’s dead stock markets
- Jul 25, 2011 - Rumors of dollar’s death greatly exaggerated
- Jul 4, 2011 - DSK all but cleared; no surprise here.
- Jun 24, 2011 - Jim Grant on Ben Bernanke
- Jun 7, 2011 - Kyle Bass and Hugh Hendry on shorting Japan
- May 20, 2011 - DSK is Tom Wolfe’s “Great White Defendant” from Bonfire of the Vanities
- May 12, 2011 - Flood coming? Don’t build an ark - build ya a moat!
Recent Comments:
- A look at the real value of gold on an historical basis. - GolfBoy: Never mind - found it here:...
- A look at the real value of gold on an historical basis. - GolfBoy: Please, anyone - what is the historical...
- EBT rap video - Quentin Perrin: Hi, Sorry I write you via comments. But I could not find contact e-mail or feedback...
- EBT rap video - Linus Huber: SCARE 20.12.2012 (Stop Corruption and Repression Effective 20.12.2012) Banks were given...
- EBT rap video - steveo: Hawaii Trading and Breakpoint Trades (BPT) is providing a free newsletter on Commodities....
- At last, NYC rental and condo markets softening - Nicole Cervantes: Does any one know some one using web fame service...
- Toppy action in dollar index, another rally in stocks coming? - fireboy and watergirl: I like this site it’s a...
- A look at the real value of gold on an historical basis. - bobby: Hi Mike, I was wondering what you think of the...
- A look at the real value of gold on an historical basis. - Bjorn: Thanks Mike, that’s very helpful
- A look at the real value of gold on an historical basis. - Mike: BTW, if you are looking for high put prices, those...


Mike
August 13th, 2009 at 7:53 am
IMO, it’s as good a lock as you ever get that this market starts to roll over hard within a few weeks:
Sentiment surveys at extreme bullishness
Put/call ratio shows extreme complacency
Rydex fund flows and OTC stock volume shows small-time specs are back
Rally on declining volume that has all but dried up
Bumping up against 38% and 50% retracements (S&P and Nasdaq)
Major dollar bearishness = dollar rally ahead
And yes, the fundamentals say that this is one of the most overvalued markets in history.
It’s important to keep an eye on the big picture and not get fooled by short-term choppiness. Rallies like this don’t give up the ghost without a fight.
jason bourne
August 13th, 2009 at 10:39 am
That Edwards & Magee quote is kind of relieving. I’m a little bit under water now on FAZ
May I add something to your points, Mike?
- VIX is forming HUGE falling wedge. If VIX is to explode upwards after completing the pattern, that means …
- Shanghai market has rolled over. In October 2007, its rolling over marked the all-time top of SPX & DJI. The top was made within the same week as the Shanghai market.
- Most likely related to the above point, China now has reduced the reckless lending significantly. Last month’s lending was only 1/4 of June’s amount. Where does the market go without artificial support? I suspect it’s related to how awful the Chinese debt auction has gone several weeks ago.
- Bearish divergences are abound almost everywhere. You name it: RSI, MACD, volume, intermarket (especially risk asset vs. safe asset correlations), etc.
Mike
August 13th, 2009 at 10:51 am
Ugh. Best to avoid the inverse ETFs. If you want to short the banks, short XLF or buy puts. ITM puts can work like inverse ETFs with less decay. My approach is to buy lots of time with far-dated ATM or OTM puts. Way better than the likes of FAZ, and it takes less cash for the same or better profits if you’re right. Always use stops to cover your butt unless you don’t care if you lose it all, with puts or the ETFs.
UDtrend
August 13th, 2009 at 11:55 am
Hey, guys
i just joined the trip of yours to the south, but i just bought the SH inverse ETF (i know is best to get put rather than inverse etf blood suckers, thought is easier to handle somehow? i dont know), FAZ is quite awesome too, falling the cliff to 25 bucks apiece, maybe worth to stock some as well. gosh, mike, how can you get that long term put?
cheers
Bjorn
August 13th, 2009 at 12:14 pm
Hi Mike,
Do you use stops even on puts dated out to Jan. or Dec. 2011?
While the rally shows signs of peaking, it could still work its way higher. Doesn’t that make it difficult to pick a stop on those far-dated puts? Since there’s lots of time, isn’t it better to trust the overall trend? Or, is that putting too much trust in a forecast?
Thanks
jason bourne
August 13th, 2009 at 12:44 pm
Mike,
My problems w/ options is mostly its liquidity and how much volatility can affect its prices. With options, the bid-offer gap is kind of big sometimes. I tried before the options way of shorting things… but didn’t work well. I don’t recall exactly, but I think I was right yet I get very little of profits or even a slight loss (due to volatility valuations, I guess — I suck at determining options volatility valuations).
I guess that’s the negative side of options. If we don’t master it that well, our probabilities get hurt (although it can sometimes work in your favour, too). With leveraged/inverse ETFs, the obvious disadvantage is with the math (the kind where 1.1 x 0.9 = 0.99 1% volatility loss; 1.2 x 0.8 = 0.96 4% volatility loss).
UDtrend
August 13th, 2009 at 12:57 pm
Today, silver is doing a bit of rally again, anyone getting ZSL inverse etf to short silver? jason are u gonna do that as well?
Mike
August 13th, 2009 at 12:59 pm
Hi Bjorn — totally depends on your risk aversion. For long dated puts, I usually start adding early with the expectation that my first purchases will go underwater. I save the majority of my capital for when the trade becomes more compelling. It may or may not be the best strategy for you or me — I usually could stand to wait longer before entering, frankly. For what it’s worth, I’ve not been doing a lot of waiting this week.
In general, I just use stops on futures, stocks, etfs and short-dated options. With long-dated options, if conditions change and my thesis is invalidated for whatever reason, I’ll just sell the old fashioned way. This makes for a very volatile portfolio.
UDtrend, if you have to ask about how to get options in this forum, please do yourself a favor and spend a lot of time reading up to familiarize yourself with them. Best to avoid them until you have watched the options market for a while, and then just wade in very slowly.
But if you continue to trade inverse ETFs, you MUST use a stop. They are so dangerous b/c they appeal to less experienced traders but they are among the most hazardous instruments in finance.
Aki_Izayoi
August 13th, 2009 at 2:19 pm
“But if you continue to trade inverse ETFs, you MUST use a stop. They are so dangerous b/c they appeal to less experienced traders but they are among the most hazardous instruments in finance.”
It is like the lottery… it is a largely a tax on those who cannot do math.
Axclr8
August 13th, 2009 at 4:24 pm
Inverse ETF’s SUCK!