Japanese yen getting oversold on low sentiment.

Traders are again very bearish on the Japanese Yen, just as they were back in March 2012, prior to its 8% rally against the USD. JPY/USD is also getting very oversold, as shown by RSI on a weekly chart.

Image

The daily chart is showing a positive divergence in RSI, a bullish sign:

Image

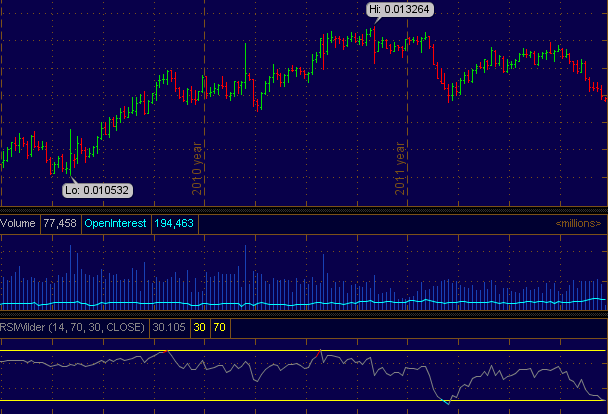
However, a glance at the monthly chart shows a major break of the uptrend since 2007, as well as a deterioration in RSI (diverting downward over the last 18 months).

Image

Traders are more bearish now than in March, but this condition has not yet been sustained for long enough to give the buy signal we had then. Also, I believe the yen may putting in a long-term top, due to the trendline break as well as developing trend of lower lows and lower highs in sentiment readings. Any multi-week rally that may be setting up should be viewed in that context, perhaps as an opportunity for entering a short position.

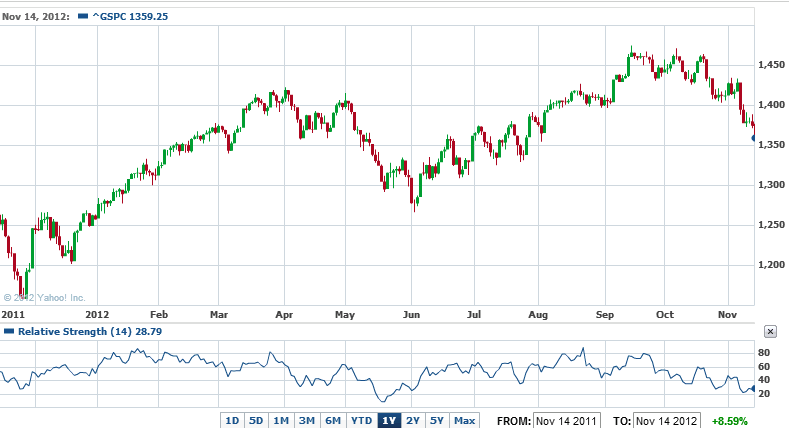
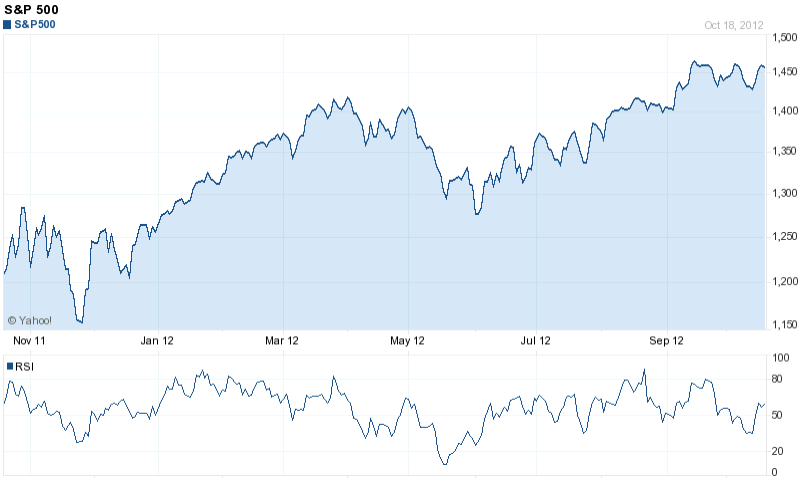
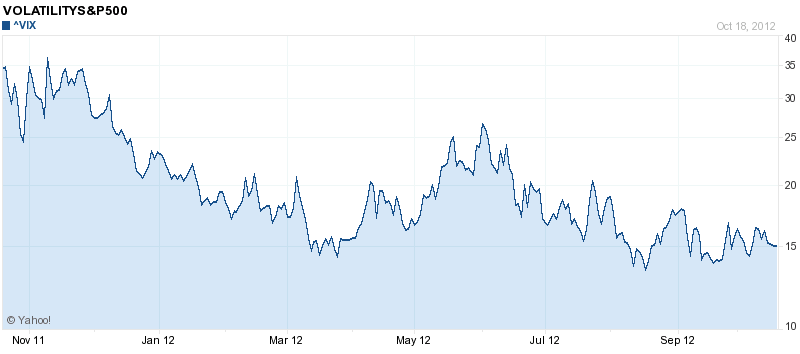
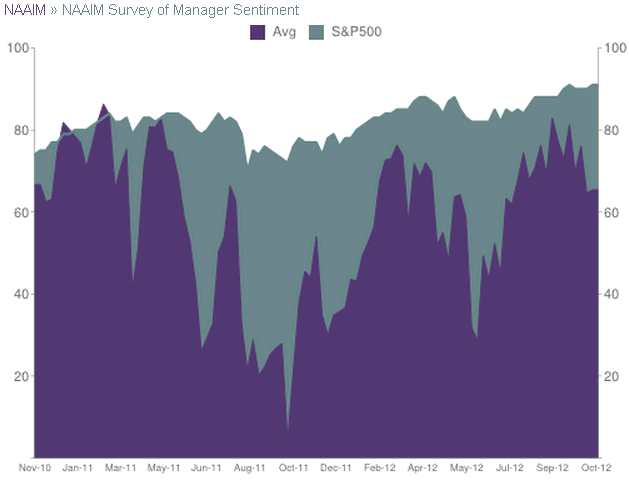
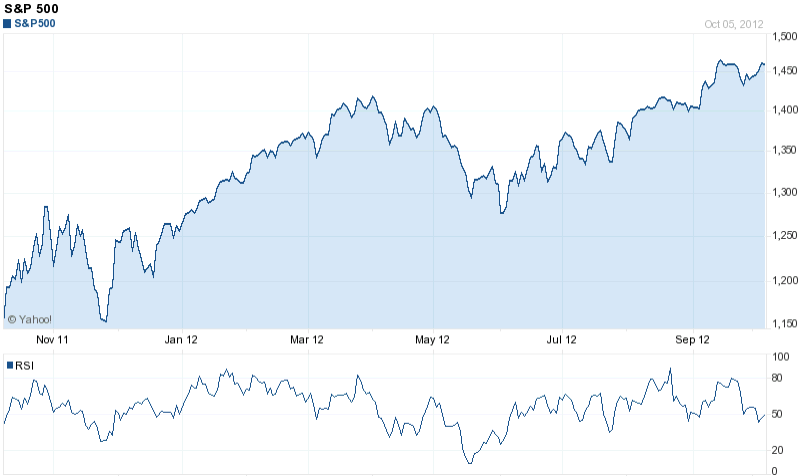
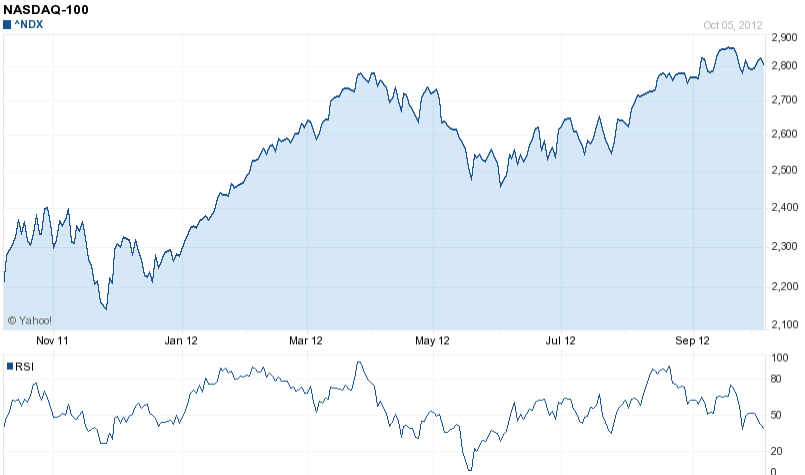
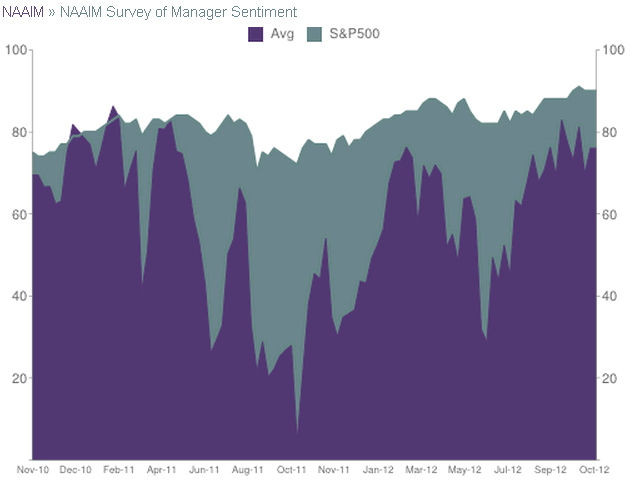
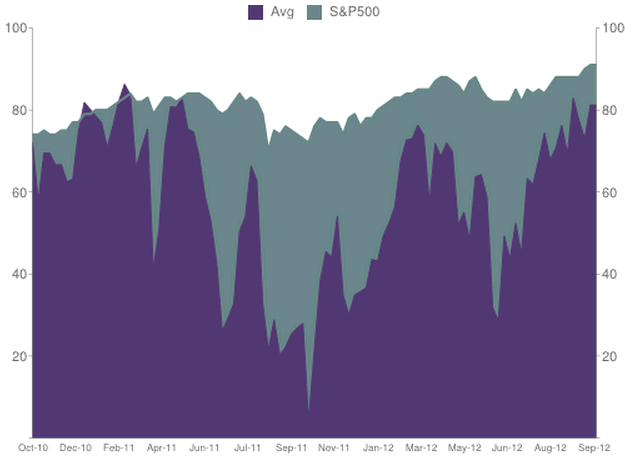
That said, a yen rally would fit into the global context of a nascent US recession and top in equities, as the yen and dollar have been safe-haven trades along with government bonds from the US, Japan, Germany and UK, among others. Sentiment on US equities has rebounded sharply since mid-November, when it reached oversold territory by some measures. Equity sentiment is not elevated, but if we are entering a bear market it need not become elevated before deteriorating again (a trend of lower lows and lower highs in sentiment was observed in 2007-2008).

One other interesting piece of data here is that Nikkei sentiment has been on the low side since mid-2011. Sometimes the yen and Nikkei have a strong negative relationship, other times positive, so I don’t know how this fits into things, unless Japan is finally going to reflate after 20 years of a bear market in stocks and strong currency and bond markets. We may indeed be at such an inflection point. I would certainly rather buy and hold Japanese equities than bonds here.

Who wants coffee?

Not many traders, apparently. Sentiment has been low for most of 2012, never even once reaching 50% bulls according to DSI. The latest slump has made futures traders extremely bearish on the beans for three weeks now, but in the first half of 2012 we saw this condition sustained for longer than I’ve ever witnessed on a contract. Despite a preponderance of bears, the price continued to slide, even at an accelerated pace, before a small rally this summer. Prices and sentiment have since returned to their lows.

Daily close, cents per pound:
coffee 2010-2012

Despite all of this bearishness and a 50% decline, coffee is still not particularly cheap by historical standards. It has been working off a mania that resulted in a parabolic doubling in 10 months from summer 2010 to spring 2011. I can’t publish the data, but picture bullishness alternating from medium-high to very high for the duration of that rally. This probably goes a long ways towards explaining the steady decline and bearishness. Prices have now returned to the base of that ramp, but if we look at a long-term chart, we can see that the spike was the final blowoff of a bull market coinciding with the general commodity boom, and that today’s price is still triple the 2001 lows. Commodities are cyclical and tend to swing from extreme to extreme, adjusted for inflation, so coffee wouldn’t be historically cheap today unless it were under $1.00/lb.

Monthly close (through Oct):
coffee 1982-2012
Indexmundi.com

I don’t see any great opportunity in coffee either way at present. It just makes an interesting study in herding behavior.

BTW, has anyone else noticed that retail bean prices at fancy grocery stores increased from the $7-10 range to the $10-13 range a couple of years ago? This coincided with the futures spike, but the correction hasn’t been passed on to consumers. Some players in the supply chain are likely enjoying fatter than usual margins.

Vast majority of traders now bearish, equities short-term oversold

The easy money for the shorts has been made. This doesn’t mean that the market is likely to rally, just that we have now enjoyed the portion of the decline that our intermediate-term sell signal in late September and early October all but guaranteed. This in no way rules out further declines immediately ahead, possibly severe. It is just that traders could easily find safer entry points for short-to-intermediate-term short sales, or worse exits.

Stocks remain at historically high valuations, economic headwinds are mounting, and bullish sentiment has been dominant for years, so we are likely at the start of a significant turn.

yahoo SPX 1 year

Budget talks are meaningless

‎- The US federal budget deficit for 2012 was $1.3 trillion.

- Military expenses (on and off budget) are going on $1.5 trillion/year.

- Entitlement expenses are $2 trillion/year and growing by $200B/year.

- Democrats’ proposed tax raise on $250k+ would net $40-50B/year.

The tax raise is only a symbolic bargaining chip. It is meaningless to the budget, which is sacrosanct to both sides. Nothing but the interest rate cycle will stop this train.

 
Image

Quick update: topping pattern still in place

Stagnant prices? Check.
High sentiment? Check.
Declining RSI? Check.

Sell that market!

SPX 1 year

vix 1 year

naaim

New highs can’t be ruled out, but starting from conditions like this, they will be small in relation to the likely decline.

Throw in a developing recession and high Shiller PE ratio, and you’ve got the strong possibility of a major top.

-
PS – If you’re in the US, and you are the voting type (I am not), please consider the Libertarian Party and Gary Johnson.

Technical update: overbought, overbullish, declining RSI

We finally have the classic syndrome that indicates an intermediate-term top. Upward momentum has stalled, as sentiment has remained elevated for several weeks. The combination of sideways prices on high bullish readings becomes very bearish when it has been sustained for a month or longer.

Here is the RSI and price picture (note declining trend in the momemtum indicator RSI since late August, and its resemblance to the topping pattern last spring):

SPX and RSI

NDX and RSI
Charts from Yahoo

A quick glance at sentiment shows sustained optimism:
NAAIM
Source: http://www.naaim.org/naaimadsenttrend.aspx

Looking at the headlines, it is nice to see good news that results in a bump with no follow-through. We saw that in mid-September with QE Infinity, and last Friday with the jobs report. Rallies end on good news and declines end on bad news.

It would not be unusual to see another test of the highs, and for prices to linger at these elevated levels for another month or so, but the odds of a sharp decline are now elevated, and any further gains should be quickly erased.

Market again overbought on overbullish sentiment

The global economy is clearly on the downswing, with the US likely having entered a recession this summer (watch for revisions in GDP and employment data in the coming months). However, as in Sept-Oct 2007, the equity market has bounced from a brief oversold interlude to a new high.

Here is the NAAIM survey. This is a relatively new dataset, but it has proved high-correlated with proven sentiment indicators like DSI and Rydex fund activity). The survey is updated each Thursday with data from Wednesday.

NAAIM Sentiment Survey, 19 Sept 2012

Sentiment has been elevated for a month, which is sufficient for a significant decline, though the likelihood of a setback and the expected magnitude thereof grows with each week that it remains elevated. This, coupled with sideways price action for few weeks (we don’t have this yet) and a declining trend in daily RSI (possibly developing) would virtually lock in the case for an intermediate-term top.

S&P500 daily chart, Yahoo Finance

EDIT: To clarify, this is not a screaming short-term sell yet, since the market has had a habit of creaping slightly higher over a few weeks from conditions like this. However, things can reverse at any time, and it is highly likely that any further gains will be quickly erased once the turn comes.

The macro picture of deteriorating economic data bolsters the case that a bull market top is near, so if this is an intermediate-term top it could prove to be the final top prior to a bear market. This cyclical bull is now 3.5 years old. This is long in comparison to the cyclical bulls of the 1910s and 1970s secular bear markets (18-36 months was typical), but short in comparison to the last cyclical bull (spring 2003 – fall 2007, 4.5 years).

Retail: some perspective on the positive July figures

Advisorperspectives.com has assembled charts showing that, adjusted for inflation and population growth, sales have only half recovered from the last recession. Sales are comparable to those of a decade ago, which is probably a healthier level than what we experienced at the height of the credit boom: 

Click to View