

Hedge funds, mutual funds and active mangers underperform and overcharge, while a simple buy-and-hold strategy regularly sustains sharp losses and lengthy secular bear markets.
So what’s an investor to do? For the rare individual who can ignore the crowd and stick to a strict discipline for years, there are elegant ways to generate outsize real returns over the very long term. Both of the following methods apply to the market as a whole and would be best used with a diversified index ETF like SPY.
Method 1 (Deep Value Only):
- Rule A: Buy when the Shiller PE is below 10.
- Rule B: Sell when the Shiller PE is above 20.
This method is very conservative, and over the last 130 years, would have twice kept you out of the market for a dozen years at a stretch. You would also have sold in 1992 when the S&P 500 was 400 and still be waiting to get back in. Assume you save in short-term T-bills in the meantime, collecting interest (when there is interest) and building cash to eventually invest when equities are cheap. Positions can be continually built with additional savings as long as the Shiller PE stays below 10.
By virtue of avoiding the brunt of nearly ever major market decline, you would still be up big on the S&P. The only major losses would have come during the end of the 1929-1932 crash, a drawdown of about 40% (vs 90% for the market). Even this risk could be reduced by averaging into long positions over 6 months.
You may have heard of turtle trading – well, this is more like the bristlecone pine that grows for thousands of years by virtue of taking root in environments without a lot of hazards. This discipline requires extreme patience, as you must make like a German and save in cash indefinitely until the market gets very cheap.
Method 2 (Deep Value plus Price Action):
- Rule A: Go long when the Shiller PE is below 10, OR when the S&P500 has fallen 40% from the highest level in the last 4 years.
- Rule B: If you last bought when the Shiller PE was below 10, or if it has fallen to 10 at any point since you bought, sell when the Shiller PE is above 20.
- Rule C: If you last bought on the 40% rule when the Shiller PE was above 10, and the PE has not subsequently declined to 10, sell when the S&P500 has gained 80% from its bear market low (even if the Shiller PE exceeds 20 before the market is up 80%).
This method combines trading plus basic value investing, and allows you to capture some additional cyclical bull markets. For example, it would have had you buy near the bottoms in 2002 and 2008 (when the Shiller PE remained above deep value levels) and sell in 2006 and 2011, respectively. These trades would have made up for missing out on the tech bubble.
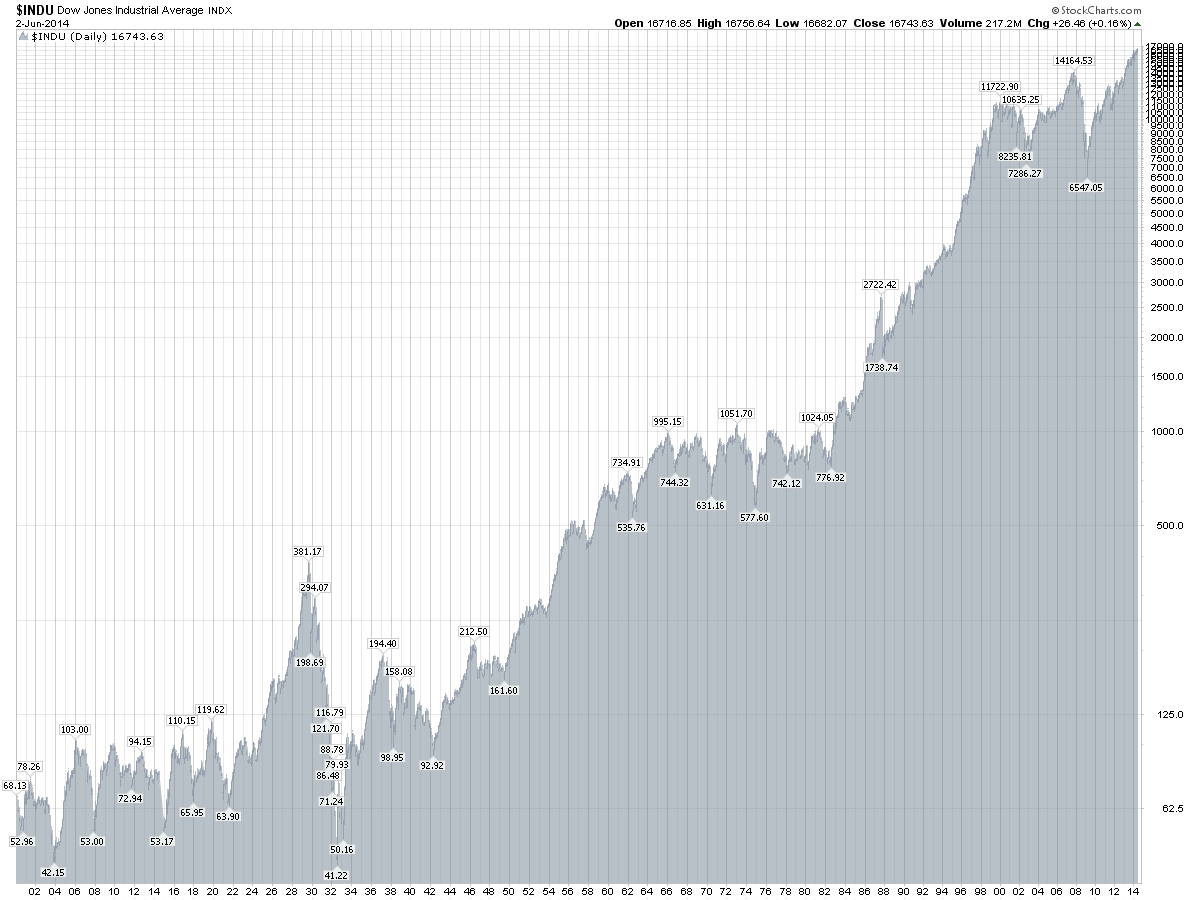
Again, the only time you would have suffered large losses under this strategy would have again been the last half of the 1929-1932 bear market. The buy-in at 40% off the 1929 peak (Dow 381) would have come in 1930 at 228, but the Dow ultimately bottomed near 40 in July 1932. No other period has seen such a relentless slide with no opportunity to sell after an 80% rally. Again, averaging into a position over 6 months from the time the market crosses the threshold of 40% or PE 10 would solve this problem.
This discipline would right now have you in cash, having missed the last two years of this likely cyclical bull, waiting patiently for another 40% decline or the restoration of value, whichever comes first.
Possible Modifications
Either of these methods can be made more aggressive or conservative by increasing or decreasing the buy-in and sell thresholds. However, Shiller PEs of 10 and 20 offer margins of safety while capturing most value buying and selling opportunities, as 40% declines and 80% rallies cover the majority of most bear and bull markets, respectively.
One way to simplify these systems even further, albeit at the expense of returns and addition of volatility, would be to never sell. This accomplishes two things: avoiding capital gains tax (Buffett often says this is his preferred tax dodge) and halving the opportunities for screwing up by not following the rules. The obvious consequence of never selling is enduring deep drawdowns during bear markets. Nonetheless, by simply saving in cash instead of buying stocks when they’re expensive, long-term returns would be far better than the index. I would hate to stay long a market with a Shiller PE well over 20, let alone 40 like in 1999-2000, but half a value discipline is better than no value discipline.
Conclusion
These methods may seem off-putting, since they require long periods of inaction, during which the prospects for making money are limited to T-bill yields. So be it. This approach is the only one I know of that 99.9% of the population has any business trying, including professional money managers. On the other hand, the methods absolutely work and produce outstanding long-term returns, which is what everyone says they want.
It’s not rocket science, so why does hardly anyone approach the market like this? Human nature of course is to blame, and Wall Street makes a living by encouraging our worst impulses. Professional investment managers may be trapped in the short-term game, but there is nothing stopping other individuals from simply opting out and doing better things with their time (like earning money the old fashioned way).
Charts that are helpful (click headers for live full-size versions):
Long-term nominal dollar Dow Jones Industrials:
Long-term inflation-adjusted Dow Jones Industrials:


