Fear is on vacation

A low and choppy equity put:call ratio on a high and choppy market remind me of the second quarter of 2007, the Goldilocks era. The 5-day average CPCE is my favorite short-term fear gauge, since it is so mean-reverting and highly predictive of stock action on a month-to-month basis.

Source: indexindicators.com

-

And here’s a 5-year shot of the VIX (the most popular fear gauge). Sure looks due for a spike:

Source: Interactive Brokers

The 2000′s in one chart

The Global Dow since 2001:

Source: wsj.com

-

This chart makes it clear that the bubble still has a lot of air left.  The 2009 lows were well above those of 2002/3, and now stocks are back into boom-time 2006 valuations, as if the credit collapse and associated declines in earnings and dividends had never happened. This year demonstrates better than any other in modern times that stock market action has very little to do with economic reality.

Hussman sees danger ahead

Top-performing mutual fund manager John Hussman sees no value in this “overvalued, overbought and overbullish” market.

Last week, the dividend yield on the S&P 500 dropped below 2%, versus a historical average closer to double that level. While part of the reason for the paucity of yield in the current market can be explained by the 20% plunge in dividend payouts over the past year, as financial companies have cut or halted dividends to conserve cash, the fact is that current payouts are not at all out of line with their historical relationship to revenues, and even a full recovery of the past year’s dividend cuts would still leave the yield at a paltry 2.5%. The October 1987 crash occurred from a yield of 2.65%, which was, at the time, the lowest yield observed in history, matched only by the 1972 peak prior to the brutal 1973-74 bear market.

Those two periods had a few other things in common. In the weeks immediately preceding the market downturn, stocks were overbought, had advanced significantly over prior weeks, bond yields were creeping higher, and investment advisory bearishness had dropped below 19%. All of those features should be familiar, because we observed them at the 1987 and 1972 peaks, and we observe them now…

So when will we accept more risk? Easy – when the expected return from accepting risk increases, or when the expected range of outcomes becomes narrower. Presently, two things would accomplish that. One is clarity, the other is better valuation.

First, and foremost, we have to get through the next 5-6 months, which is where we will at least begin to see the extent to which “second wave” credit risks materialize. We emphatically don’t need to work through all of the economy’s problems. What we do need, however, is for the latent problems to hatch, so we can have more clarity about what we’re dealing with. I’m specifically referring to the second round of delinquencies and foreclosures tied to Alt-A and Option-ARM loans, the requirement beginning in January that banks and other financials bring “off balance sheet” entities onto their books (which, as Freddie Mac observed in a recent footnote, “could have a significant negative impact on its net worth”), and the disposition of a mountain of mortgages that have been increasingly running delinquent, but where foreclosure has been temporarily delayed.

-

Hussman’s fund doesn’t go net-short, but past times when he’s gone fully-hedged have been good opportunities to think about short selling.

Detroit, model for future US?

Hat tip to Mish for this explanation of how government ruined one of the wealthiest cities in the world:

-

Now, if the government had let Chrysler and GM go under, their factories would have been bought by Toyota and Honda and their employees would be turning out cars that people actually want, not gems like the Aztec:

.
.
.
.
.
.
.
.
.
.
.
.
.
.

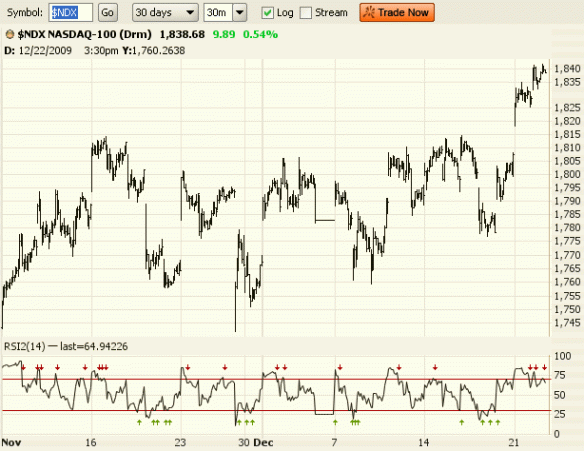
Nasdaq at major resistance

Look at how important this level is for the Nasdaq 100 .  It has been both resistance and support and seen breakaways and breakdowns. It also happens to be the 61.8% Fibonnacci retracement of the ’07-’09 decline.

Source: Prophet.net

-

Levels like this are not voodoo. When there has been a lot of activity at a certain price, there is much emotional weight attached to it. In this case, those who went long the Nasdaq and its components at this price must be delighted to be breaking even here. Those who decide to count their blessings and sell provide supply, as do the other longs and short sellers who recognise the importance of the level. If there is more eagerness from buyers than sellers here, that supply will be absorbed and prices can move higher, as people get more confident that the bear market levels are behind us. Of course you could say that for any level, but levels that have previously lead to multiple reversals or accelerations have extra importance.

A breakthrough here will mean a lot more if the S&P500 and Dow follow suit. As noted before, in ’07 and ’08 the NDX had a habit of coasting higher just as things deteriorated. The Dow and SPX of course are still under their highs so far.

3rd Quarter GDP revised lower again

The bulls cheered when the Department of Commerce told us GDP was 3.5%, but then the estimate was quietly lowered to 2.8%, and now we hear that 2.2% is a more like it. In reality of course, when you take away government expenditures, which should not be in GDP anyway as they are not Production, the economy continued to shrink. What else would you believe given that credit is still rapidly contracting and government is throwing sand into any market mechanisms that would clear away the bad debt?

Shorting the Nasdaq and Russell 2000

Both are overbought on flagging momentum. Note the high and downsloping RSI (Relative Strength Index) since yesterday:

Source: Prophet.net

-

I’ve been playing around with Tim Knight’s creation, Prophet Charts, and I have to hand it to him — this is the best assembly of technical analysis tools that I’ve seen.  Stockcharts.com is still pretty good for a free service, though (I haven’t tried their subscription tools).

Also of note today is that the VIX has broken 20. Options are cheaper than at any point since the Summer of ’08. The lofty equity valuations, flagging momentum and sense of complacency remind me of the Goldilocks winter and spring of ’07, when prices drifted upward slowly in a narrow channel before suddenly cracking, first with a 400 pt decline in the Dow on one late February day, then with the seizing of the credit markets in late July.